Industrial Strategies Division
Net Flow of Compliance Instruments
The California Cap-and-Trade Program and Québec Cap-and-Trade System have been linked since January 2014. Linking enables registered entities to trade and use compliance instruments, allowances and offset credits, interchangeably across the linked programs.
Linking allows for a shift in GHG emissions between jurisdictions as compared to a hypothetical scenario in which the jurisdictions’ cap-and-trade programs are not linked. Linking thus enables GHG emissions to be reduced wherever it is most cost efficient by broadening the options for least cost reductions opportunities.
A jurisdiction whose entities have purchased and retired compliance instruments issued by another jurisdiction gains the possibility for emissions from its covered sectors to potentially exceed its cap. Entities from a jurisdiction with a net outflow of compliance instruments effectively forego the right to emit the corresponding GHG emissions. While linking helps to achieve aggregate mitigation targets at lowest cost, linked jurisdictions should identify and account for any shift in emissions so that each jurisdiction can account for any net transfer of compliance instruments and implications for meeting its own GHG emission targets.
In recognition of this dynamic, Article 8 of the Agreement on the Harmonization and Integration of Cap-and-Trade Programs for Reducing Greenhouse Gas Emissions (Linkage Agreement) states that the jurisdictions will develop an accounting mechanism to calculate the net flow of compliance instruments and will implement corresponding adjustments in their respective GHG emissions accounting frameworks based on these net flows.
Net Flow of Compliance Instruments Documents
- Accounting Mechanism for Article 8 of the 2017 Linkage Agreement
- Report on the Net Flow of Compliance Instruments between Québec and California for the Period 2013-2023
- Corresponding Adjustments Pursuant to Article 8 of the 2017 Linkage Agreement
Cap-and-Trade Program Data Dashboard
This dashboard provides charts for allowance allocation, ARB offset credit issuance, auction data, market activity, and the Voluntary Renewable Electricity Program. All Cap-and-Trade Program data reports are available on Cap-and-Trade Program Data.
List of Figures
- Annual Allowance Budgets
- Carbon Allowance Prices
- Auction Proceeds
- Auction Qualified Bidders
- Herfindahl-Hirschman Index Values for Current Auctions
- Herfindahl-Hirschman Index Values for Advance Auctions
- Vintage 2025 Allowance Allocation
- Vintage 2023 Industrial Allocation and 2023 Emissions
- EDU Use of Allowance Value
- NGS Use of Allowance
- ARB Offset Credit Issuance
- Forest Buffer Account Balance
- Summary of Market Transfers by Year
- Summary of Market Transfers by Quarter
- Voluntary Renewable Electricity Program Allowance Retirements by Generation Year
Annual Allowance Budgets
Download chart data. This data includes Vintage Year Allowance Allocation and is not adjusted for true-up allocation. 2024 and 2025 Energy Imbalance Market Outstanding Emissions (EIM OE) data are not yet available. VRE refers to the Voluntary Renewable Electricity program. The allowance cap through 2030 is prescribed by the Cap-and-Trade Regulation. Future years are represented in the grayed-out bars and will be updated once allocation data for those years is available. Industrial and utility allocation data can be found on the Program Data webpage.
Auction Data
California and Québec held their first joint auction in November 2014. All the charts in this section (except for the Auction Proceeds chart) begin with Q4 2014.
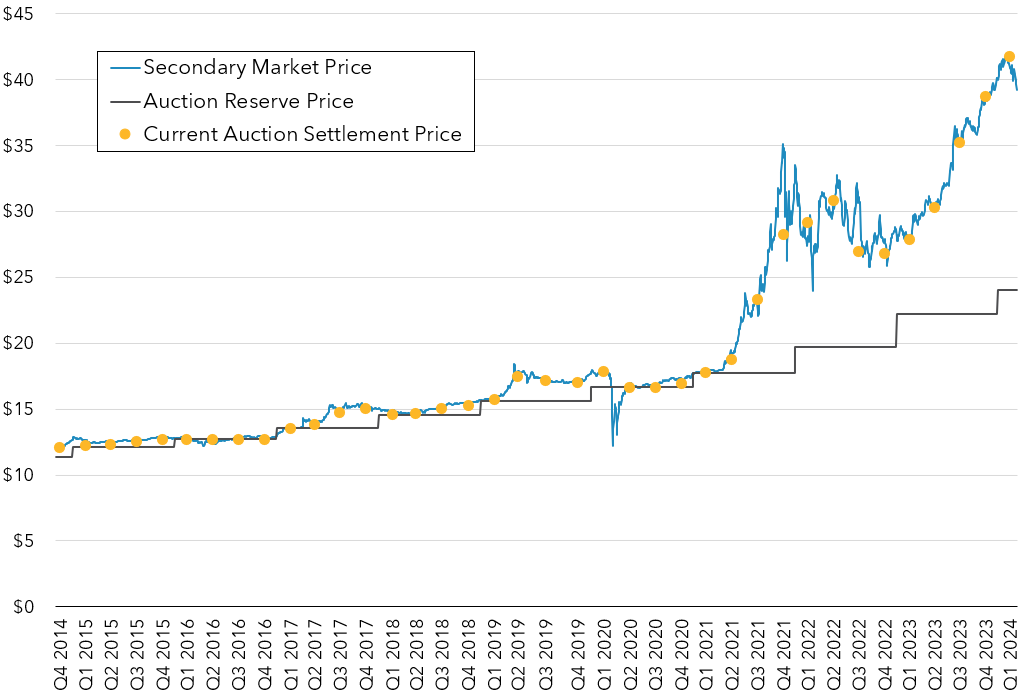
Carbon Allowance Prices
Notes:
- California and Québec held their first joint auction in November 2014.
- Current Auction Settlement Price is the price at which current vintage allowances sold at auction.
- Auction Reserve Price is the minimum price at which allowances can be sold at auction.
- Secondary Market Price is a composite of commodity exchange futures contract prices for near month delivery and a survey of OTC brokered transactions for California Carbon Allowances. Secondary market prices are provided with permission of Argus Media Inc.
- Secondary Market Price data is given through June 9, 2025.
Download chart data (Argus Media Inc. data not included). For more information see Summary of Auction Settlement Prices and Results and Auction Information.
Auction Proceeds by Fiscal Year or Auction Quarter
Download chart data. For more information on auction proceeds see Summary of Auction Proceeds and Auction Information. For more information on California Climate Investments see California Climate Investments. For more information on California Climate Credits and other uses of proceeds provided to utilities for ratepayer protection see reports on use of allocated allowance value at Electrical Distribution Utility and Natural Gas Supplier Allowance Allocation.
Auction Qualified Bidders
* A qualified bidder is an entity that completed an auction application, submitted a bid guarantee that was accepted by the Financial Services Administrator, and was approved by California or by a linked jurisdiction to participate in the auction.
A Covered Entity (CE) is a registered entity subject to the California Cap-and-Trade Regulation (Regulation) with a facility or emissions source exceeding the applicable greenhouse gas emissions threshold level specified in section 95812(a) of the Regulation. A covered entity is required to participate in the Cap-and-Trade Program and will have a compliance obligation due each year to CARB based on the requirements in subarticle 7 of the Regulation.
A Voluntarily Associated Entity (VAE) or “General Market Participant” is an individual or organization that is not a covered entity with a covered emissions source that exceeds the emissions inclusion threshold. A VAE is a registered entity that intends to purchase, hold, sell, or voluntarily retire compliance instruments and can include an entity operating an offset project or early action offset project that is registered with CARB pursuant to subarticle 13 or 14 of the Regulation.
Download chart data. For more information see Summary Results Reports at Auction Notices and Reports.
Herfindahl-Hirschman Index Values for Current Auctions
The Herfindahl-Hirschman Index (HHI) is a common measure of market concentration used to express competitiveness. Lower HHI values are desirable as they indicate a greater number of participants were successful and competitive. Higher HHI values indicate fewer participants were successful representing a less competitive outcome.
* Highly Concentrated (HHI > 2,500) and Moderately Concentrated (1,500 < HHI < 2,500) ranges from the U.S. Department of Justice.
Download chart data (includes both Current Auctions and Advance Auctions HHI values). For more information see Summary Results Reports at Auction Notices and Reports.
Herfindahl-Hirschman Index Values for Advance Auctions
* Highly Concentrated (HHI > 2,500) and Moderately Concentrated (1,500 < HHI < 2,500) ranges from the U.S. Department of Justice.
Download chart data (includes both Current Auctions and Advance Auctions HHI values). For more information see Summary Results Reports at Auction Notices and Reports.
Allocation Data
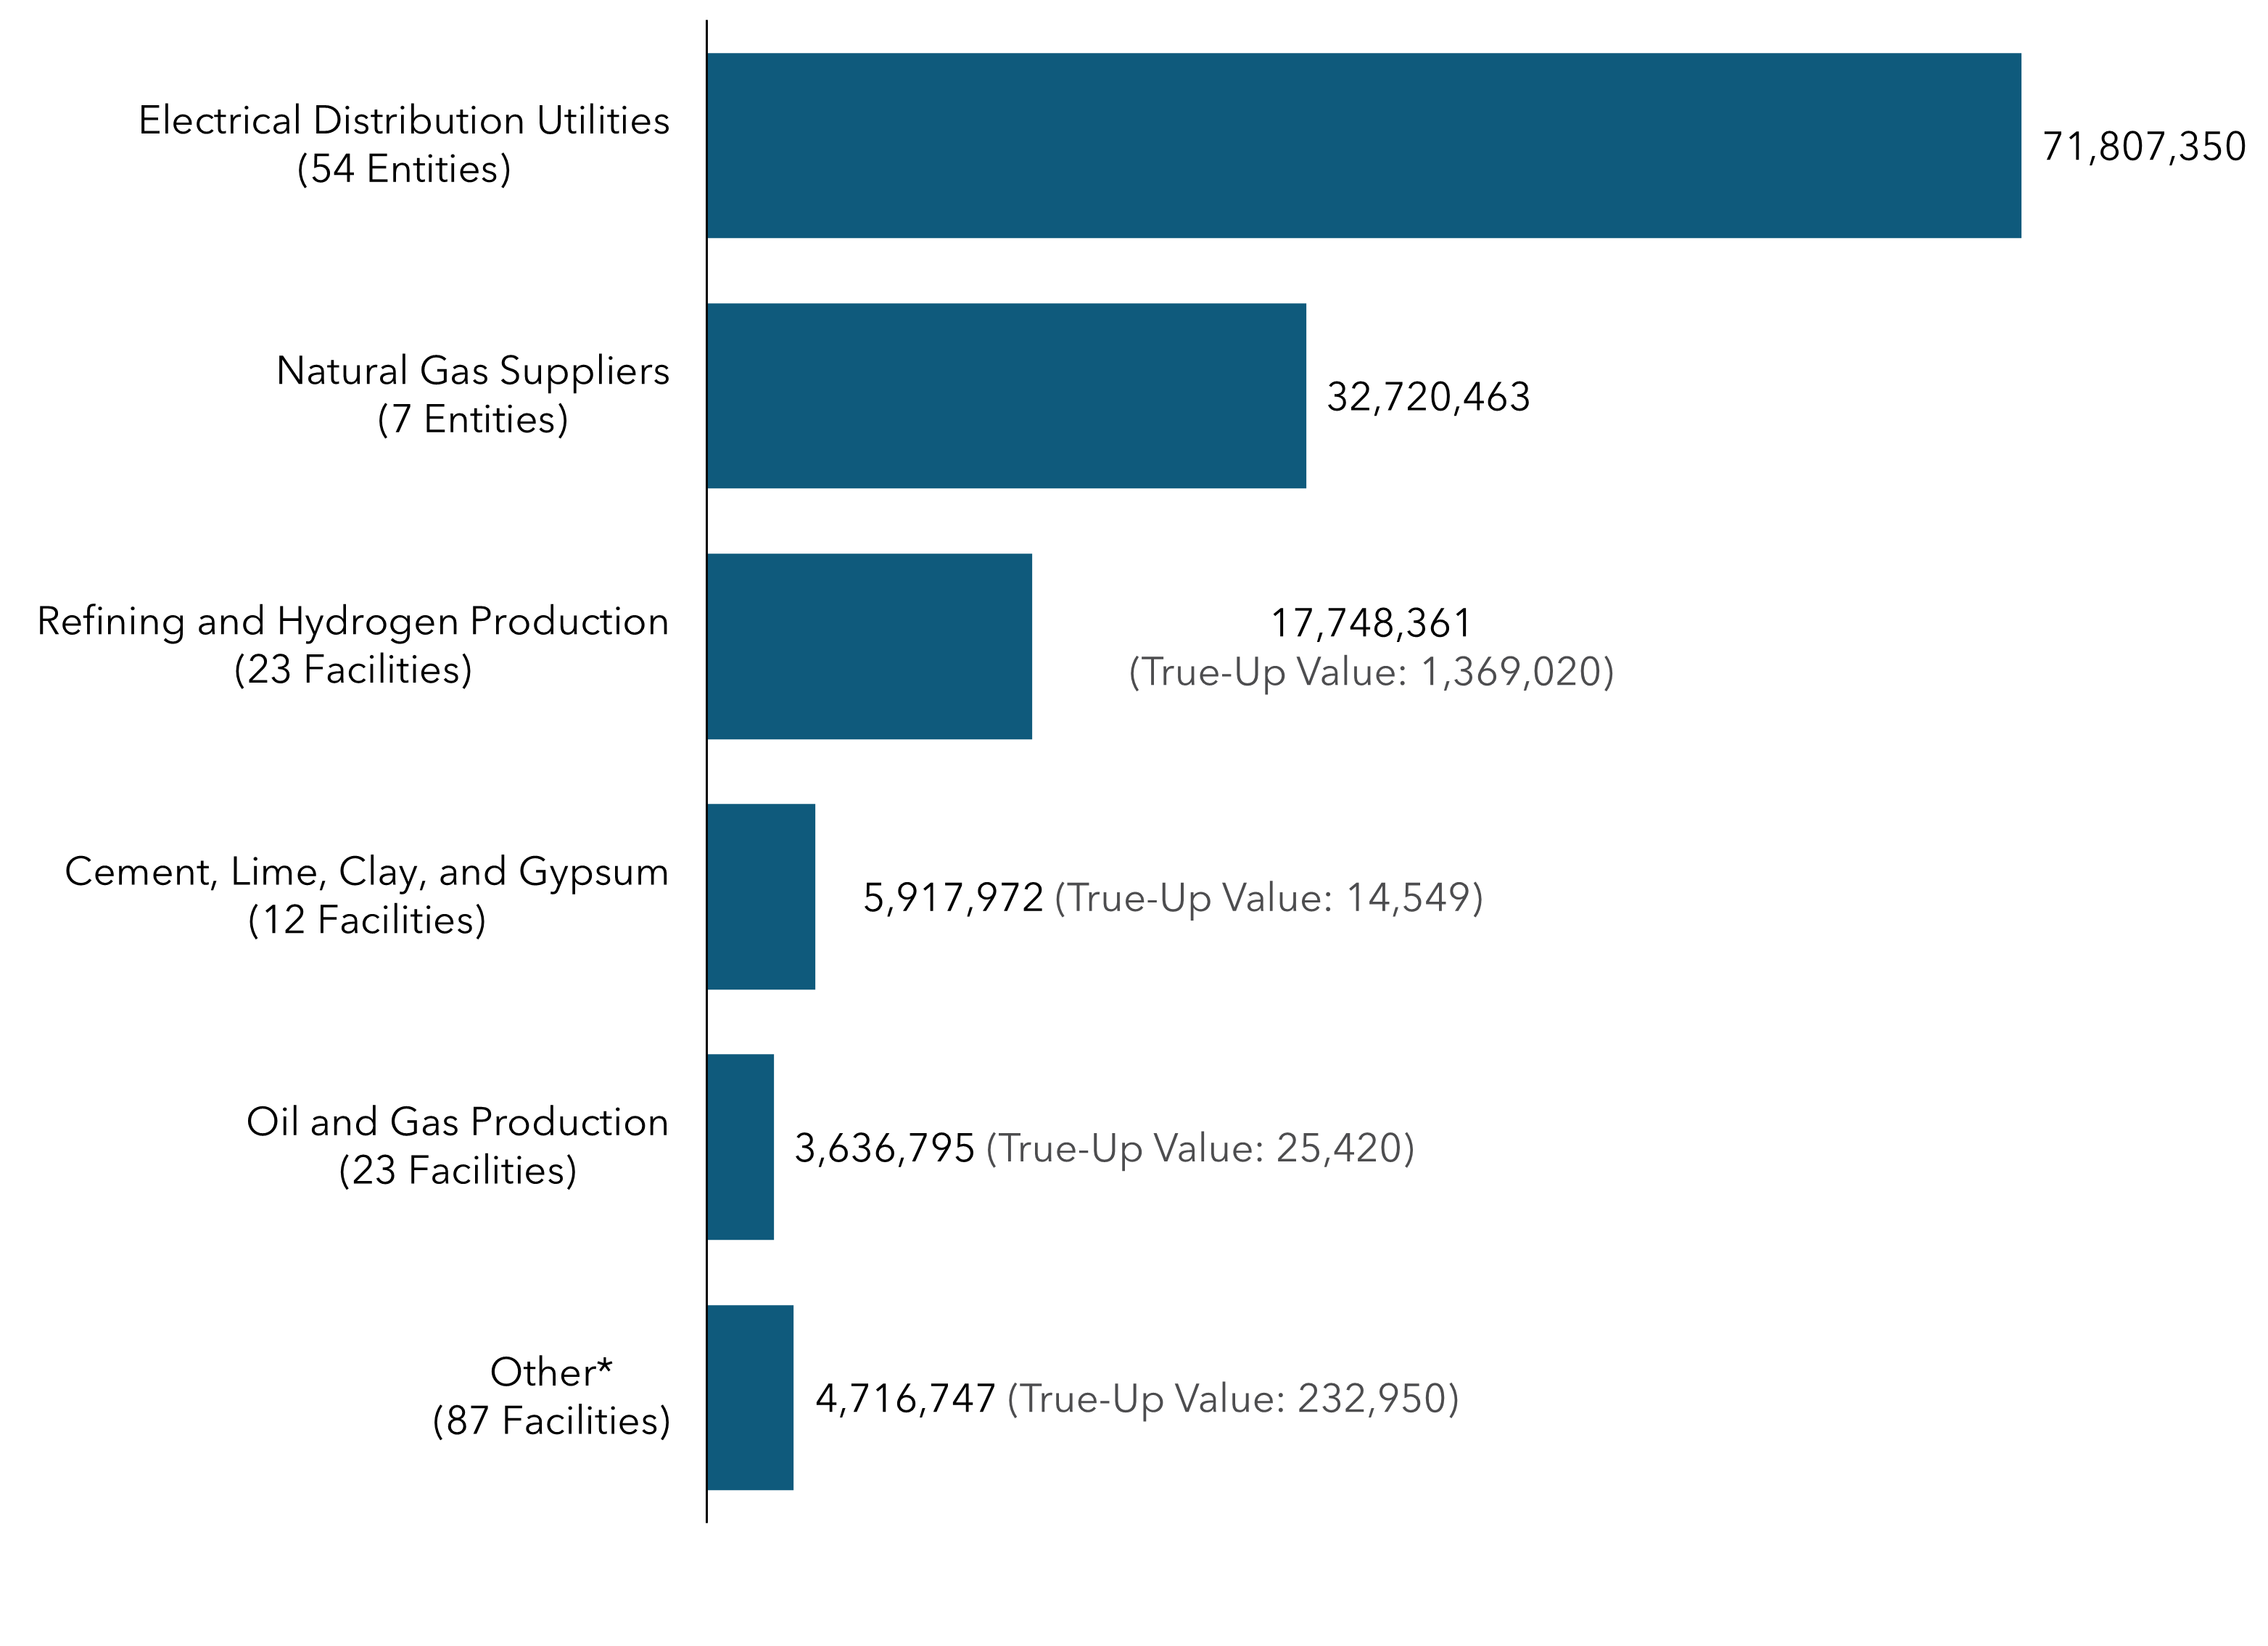
Vintage 2025 Allowance Allocation

* Other includes all industrial sectors listed in the Vintage 2025 Allowance Allocation Summary not otherwise listed in this chart, plus legacy contract generators, universities, public service facilities, public wholesale water agencies, and waste-to-energy facilities.
Download chart data. For more information see Vintage 2025 Allowance Allocation Summary and Allowance Allocation.
Vintage 2023 Industrial Allocation and 2023 Emissions
Download chart data. Other includes all industrial sectors listed in the Vintage 2025 Allowance Allocation Summary not otherwise listed in this chart, plus legacy contract generators and waste-to-energy facilities to protect confidential data. Industrial and utility allocation data can be found at the Program Data webpage. Facility level emissions data can be found on the MRR Data webpage.
Electrical Distribution Utility Use of Allocated Allowance Value in 2013-2023 (Total = $16B)
Download chart data. Residential Return and Industry and Small Business Returns include volumetric and non-volumetric returns. For Investor-owned utilitiess, the Residential Return is the California Climate Credit, and the Industry Return is the California Industry Assistance Credit. Effective April 1, 2019, purchasing allowances with allocated allowance value is prohibited. For more information, see Electrical Distribution Utility and Natural Gas Supplier Allowance Allocation.
Natural Gas Supplier Use of Allocated Allowance Value in 2015-2023 (Total = $6.9B)
Download chart data. For Investor-owned utilitiess, the Residential Return is the California Climate Credit. Effective April 1, 2019, purchasing allowances or netting Natural Gas Supplier allowance value against Program compliance costs is prohibited.
For more information, see Electrical Distribution Utility and Natural Gas Supplier Allowance Allocation.
Offset Data
ARB Offset Credit Issuance
For more information see ARB Offset Credit Issuance Table and Compliance Offset Program.
Forest Buffer Account Balance Over Time
Download chart data. The Forest Buffer Account is a general insurance mechanism against unintentional reversals for ARB offset credits issued to forest offset projects. For more information see California's Compliance Offset Program FAQ.
Market Activity Data
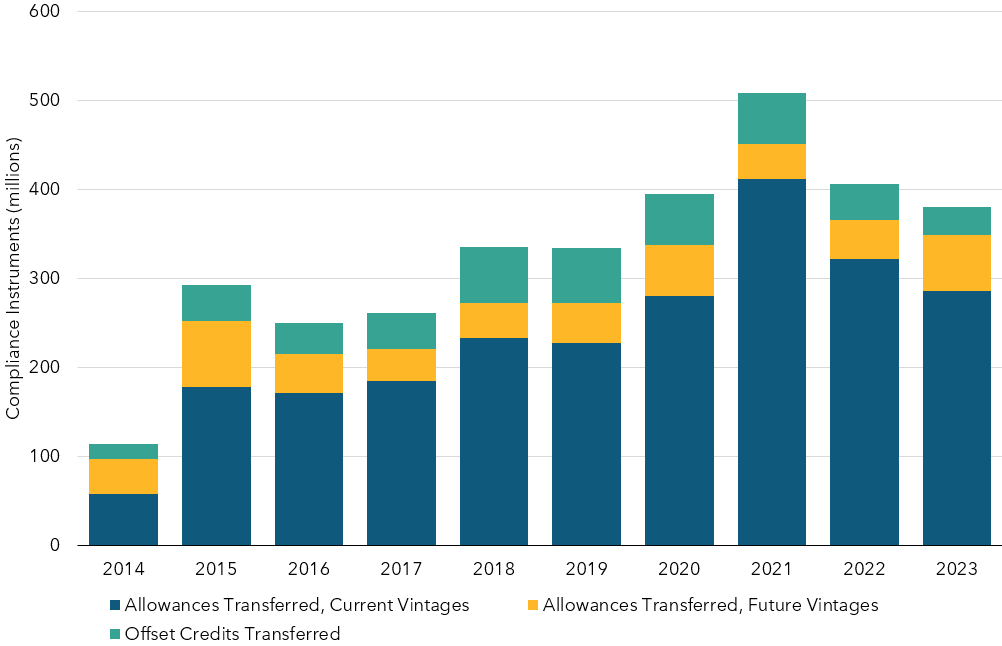
Summary of Market Transfers by Year
Download chart data. For more information see Summary of Market Transfers Report.
Summary of Market Transfers by Quarter
Download chart data. For more information see Summary of Market Transfers Report.
VRE Program
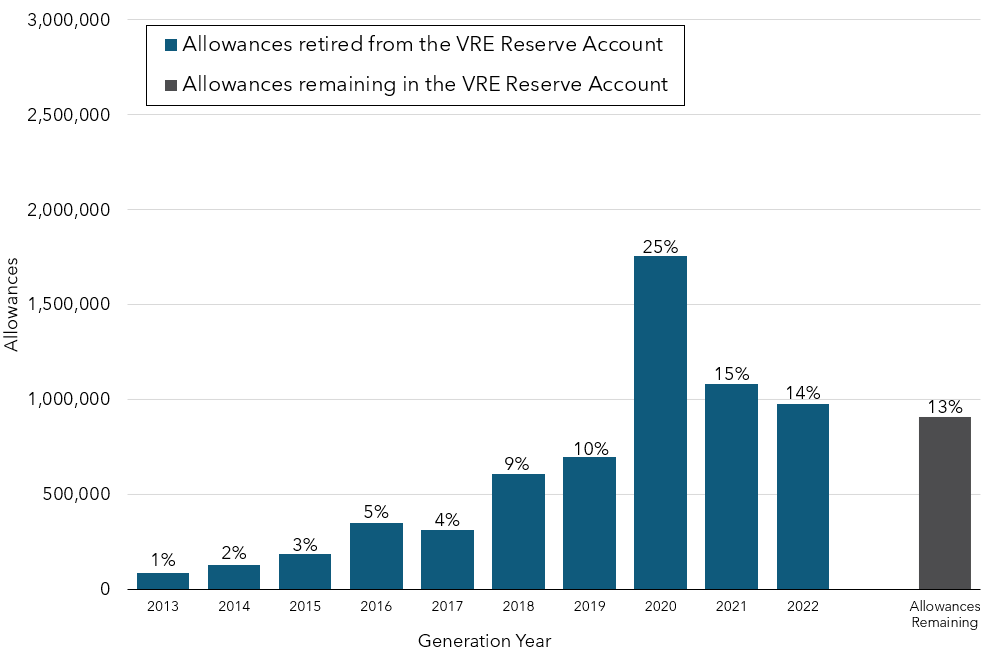
Voluntary Renewable Electricity (VRE) Program Allowance Retirements by Generation Year
Download allowances retired data and allowances remaining data. For more information see Voluntary Renewable Electricity Program.
CARB-Accredited MRR Verifiers of GHG Emissions
This website is for CARB-accredited GHG verifiers for CARB's Mandatory Reporting Regulation. Please contact us at ghgverify@arb.ca.gov with questions.
Recent Updates
Cal e-GRRT Step by Step Guide for Verifiers
MRR Regulation (PDF) (MS Word)
List of Reporting Entity Contacts and COI Status for accredited verifiers (as of 7/1/25)
CARB Verification Services Audit Checklist
Application for Upgrade to Lead Verifier or to add Sector
Webinar for Accredited Verifiers
The Verifier Kickoff Webinar for 2024 data occurred on February 12, 2025. Accredited verifiers can view the recording at the link below.
Link to webinar slides for accredited verifiers (password required)
Verifier Accreditation Training
Training FAQ - The February 2024 MRR verifier accreditation training was completed. To attend a future training, please email ghgverify@arb.ca.gov.
Errata (as of 2/23/24)
Course 1 (Verifier Training)
Course 1 recordings
1.1 slides | b/w
1.2 slides | b/w
1.3 slides | b/w
1.4 slides | b/w
Handouts | case study | case study answers
Course 2 (Transactions)
Course 2 recordings
2.1 (Electric Power Entities) slides | b/w | 2.1.CS w/o answers | Handouts)
2.2 (Transportation Fuel Suppliers) slides | b/w
2.3 (Natural Gas Suppliers) slides | b/w
2.4 (Carbon Dioxide Suppliers) slides | b/w
Course 2.2-2.4 Handouts
Course 3 (Oil and Gas)
Course 3 recordings
3.1 (PNG Systems) slides | b/w
3.2 (Refineries) slides | b/w
3.3 (Hydrogen Production) slides | b/w
Case Studies
Course 4 (Process emissions training from 2015)
Guidance
Reporting guidance is posted on the guidance page.
Technical Guidance for Assuring Measurement Device Data Accuracy
Example Calculation for Verification of Reprocessed Tomato Product Data
Listserve Information
There are 2 CARB listserves related to GHG Mandatory Reporting:
- Public reporting & verification list (ghg-rep). You may subscribe/unsubscribe yourself, including changing your email address.
- MRR accredited verifier-only list (ghgverifiers). Please send ghgverify@arb.ca.gov an email if your email address changes. Verifiers cannot update this list without CARB assistance.


