Cap-and-Trade Program Data Dashboard
This dashboard provides charts for allowance allocation, ARB offset credit issuance, auction data, market activity, and the Voluntary Renewable Electricity Program. All Cap-and-Trade Program data reports are available on Cap-and-Trade Program Data.
List of Figures
- Annual Allowance Budgets
- Carbon Allowance Prices
- Auction Proceeds
- Auction Qualified Bidders
- Herfindahl-Hirschman Index Values for Current Auctions
- Herfindahl-Hirschman Index Values for Advance Auctions
- Vintage 2026 Allowance Allocation
- Vintage 2024 Industrial Allocation and 2024 Emissions
- EDU Use of Allowance Value
- NGS Use of Allowance
- ARB Offset Credit Issuance
- Forest Buffer Account Balance
- Summary of Market Transfers by Year
- Summary of Market Transfers by Quarter
- Voluntary Renewable Electricity Program Allowance Retirements by Generation Year
Annual Allowance Budgets

Download chart data. This data includes Vintage Year Allowance Allocation and is not adjusted for true-up allocation. EIM outstanding emissions are calculated using reported year data (2024) and are applied to the vintage year (2026) for total budget calculations. VRE refers to the Voluntary Renewable Electricity program. The allowance cap through 2030 is prescribed by the Cap-and-Trade Regulation. Future years are represented in the grayed-out bars and will be updated once allocation data for those years is available. Industrial and utility allocation data can be found on the Program Data webpage.
Auction Data
California and Québec held their first joint auction in November 2014. All the charts in this section (except for the Auction Proceeds chart) begin with Q4 2014.
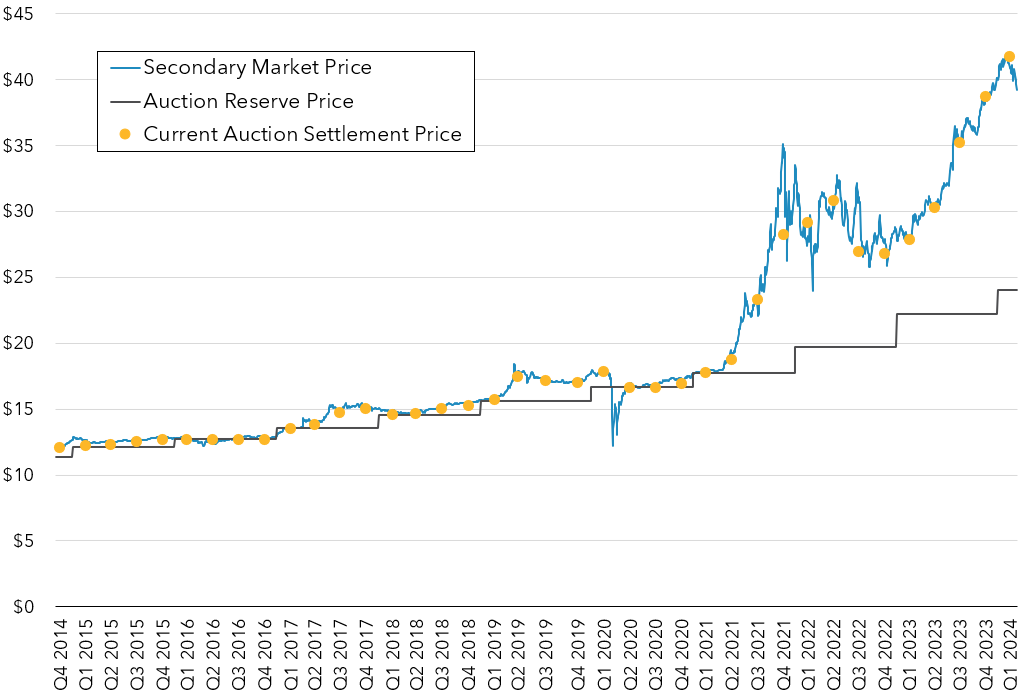
Carbon Allowance Prices
Notes:
- California and Québec held their first joint auction in November 2014.
- Current Auction Settlement Price is the price at which current vintage allowances sold at auction.
- Auction Reserve Price is the minimum price at which allowances can be sold at auction.
- Secondary Market Price is a composite of commodity exchange futures contract prices for near month delivery and a survey of OTC brokered transactions for California Carbon Allowances. Secondary market prices are provided with permission of Argus Media Inc.
- Secondary Market Price data is given through December 8, 2025.
Download chart data (Argus Media Inc. data not included). For more information see Summary of Auction Settlement Prices and Results and Auction Information.
Auction Proceeds by Fiscal Year or Auction Quarter
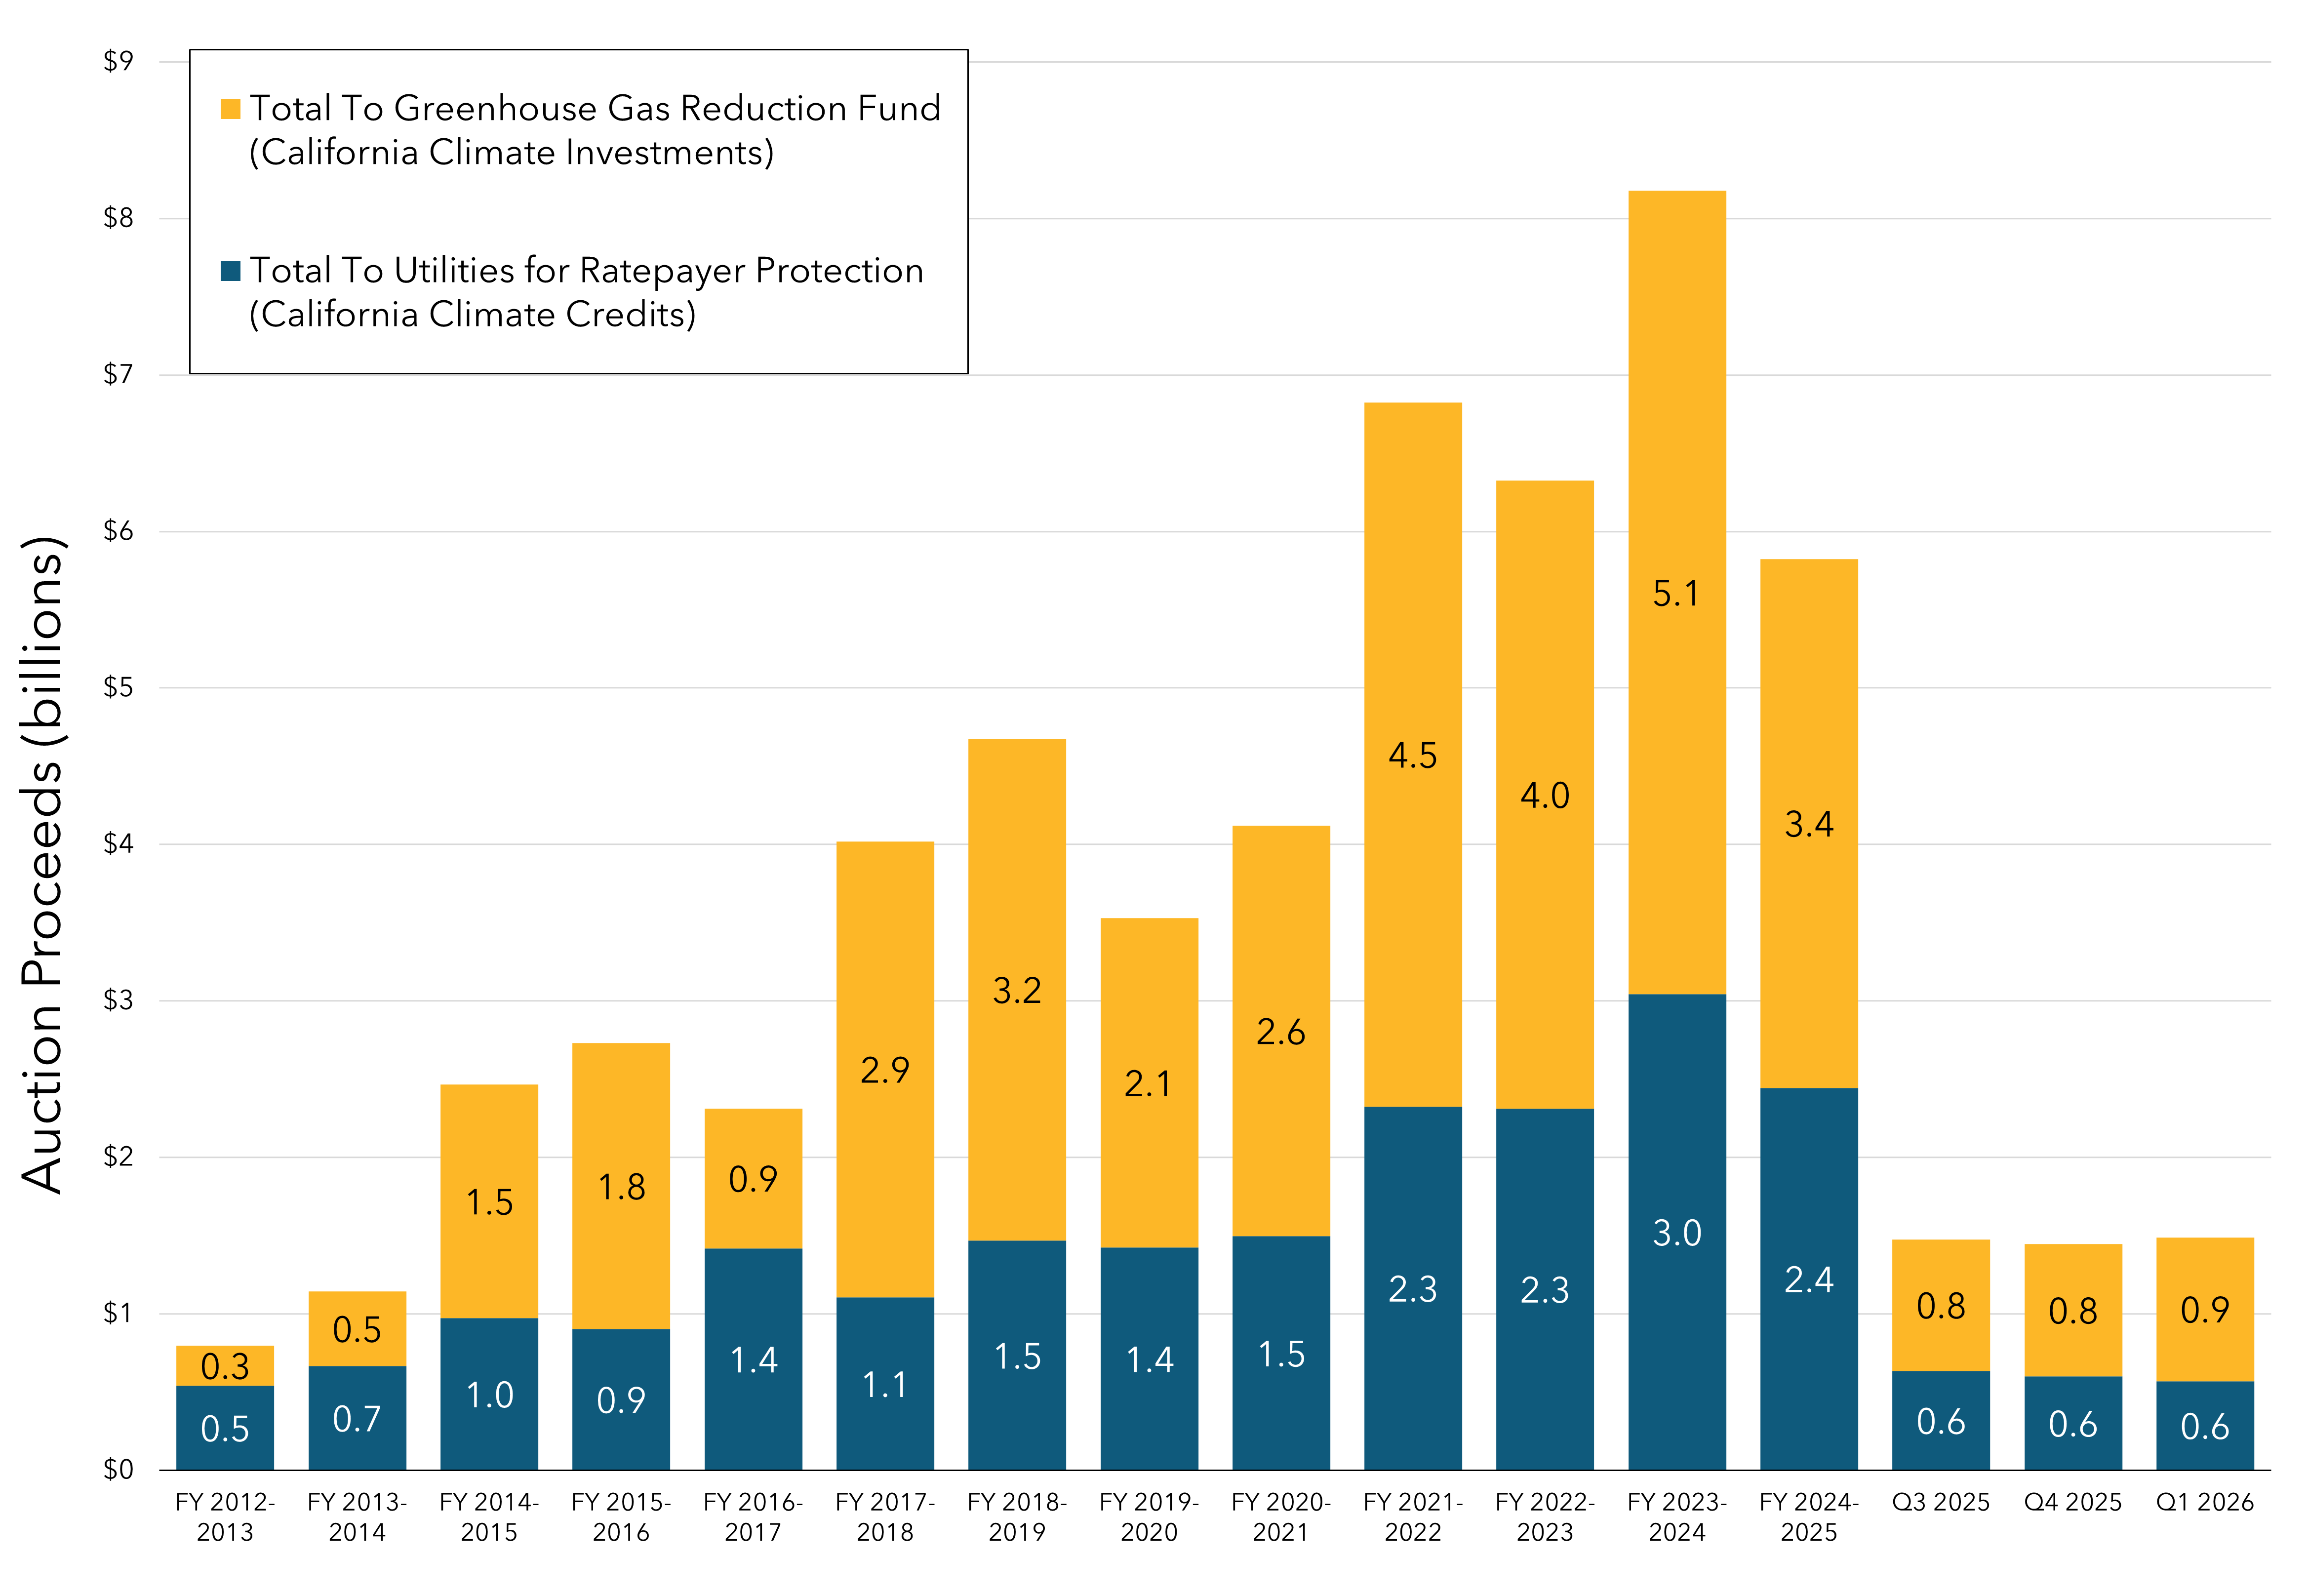
Download chart data. For more information on auction proceeds see Summary of Auction Proceeds and Auction Information. For more information on California Climate Investments see California Climate Investments. For more information on California Climate Credits and other uses of proceeds provided to utilities for ratepayer protection see reports on use of allocated allowance value at Electrical Distribution Utility and Natural Gas Supplier Allowance Allocation.
Auction Qualified Bidders
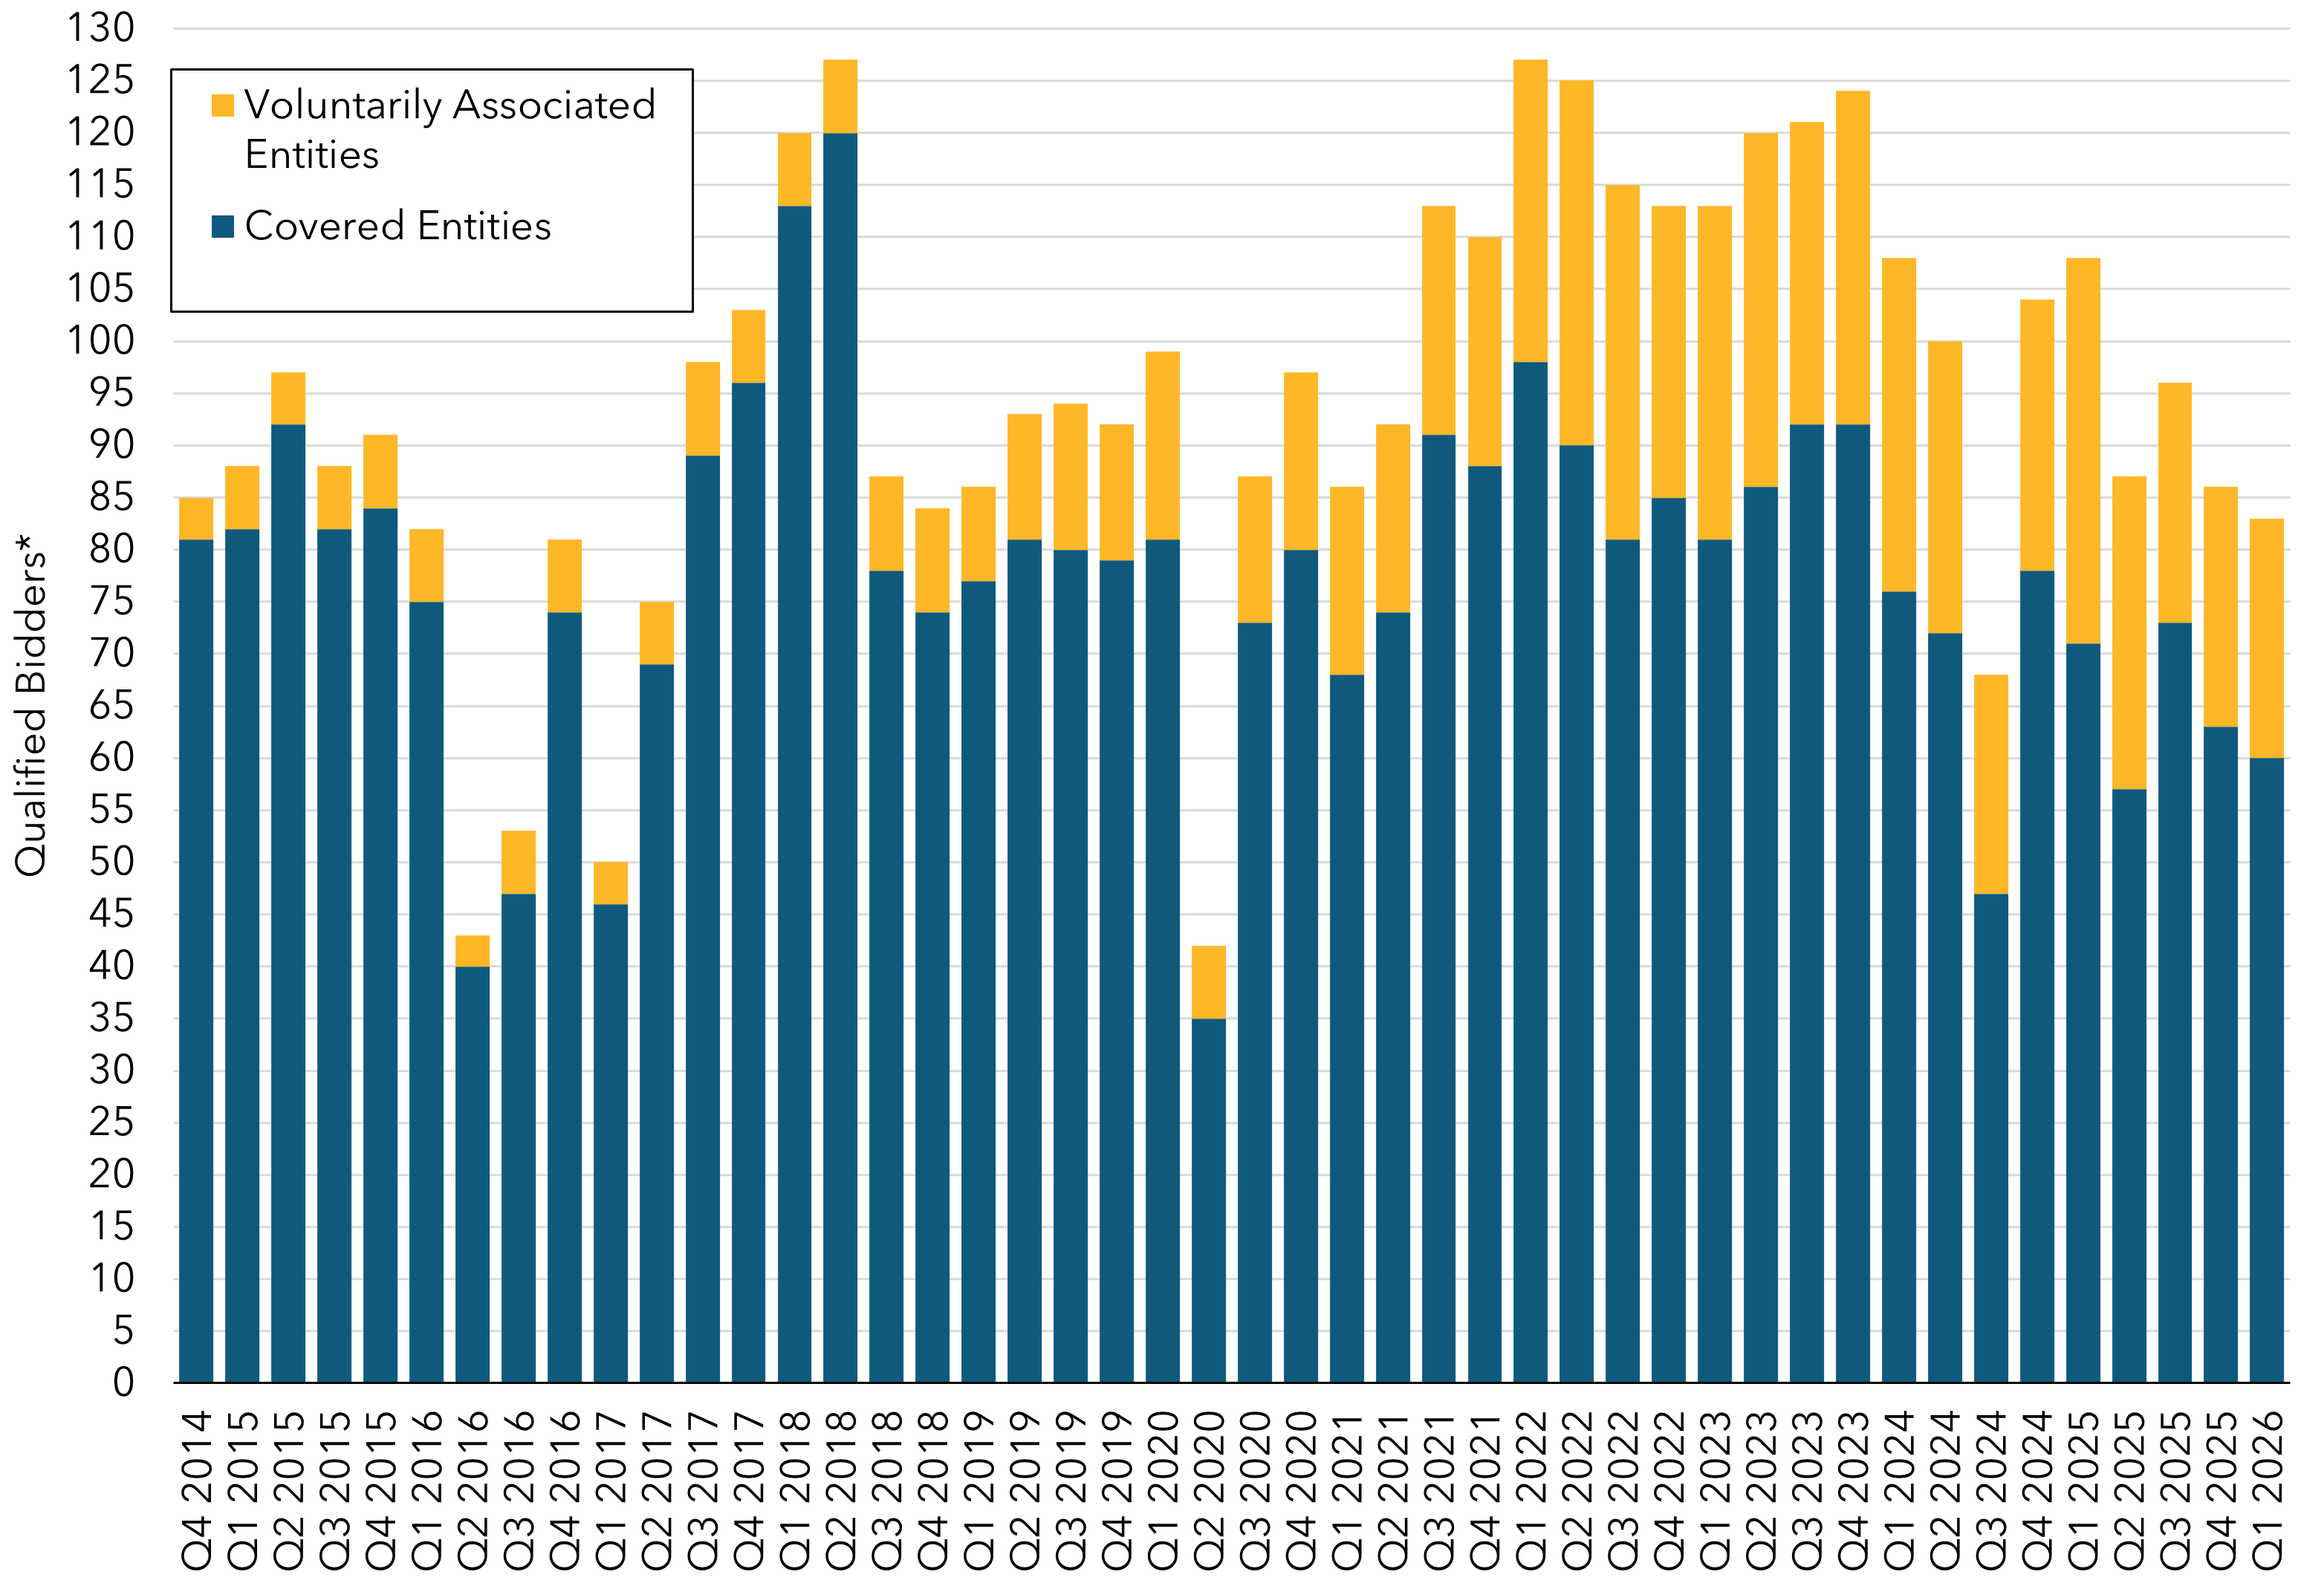
* A qualified bidder is an entity that completed an auction application, submitted a bid guarantee that was accepted by the Financial Services Administrator, and was approved by California or by a linked jurisdiction to participate in the auction.
A Covered Entity (CE) is a registered entity subject to the California Cap-and-Trade Regulation (Regulation) with a facility or emissions source exceeding the applicable greenhouse gas emissions threshold level specified in section 95812(a) of the Regulation. A covered entity is required to participate in the Cap-and-Trade Program and will have a compliance obligation due each year to CARB based on the requirements in subarticle 7 of the Regulation.
A Voluntarily Associated Entity (VAE) or “General Market Participant” is an individual or organization that is not a covered entity with a covered emissions source that exceeds the emissions inclusion threshold. A VAE is a registered entity that intends to purchase, hold, sell, or voluntarily retire compliance instruments and can include an entity operating an offset project or early action offset project that is registered with CARB pursuant to subarticle 13 or 14 of the Regulation.
Download chart data. For more information see Summary Results Reports at Auction Notices and Reports.
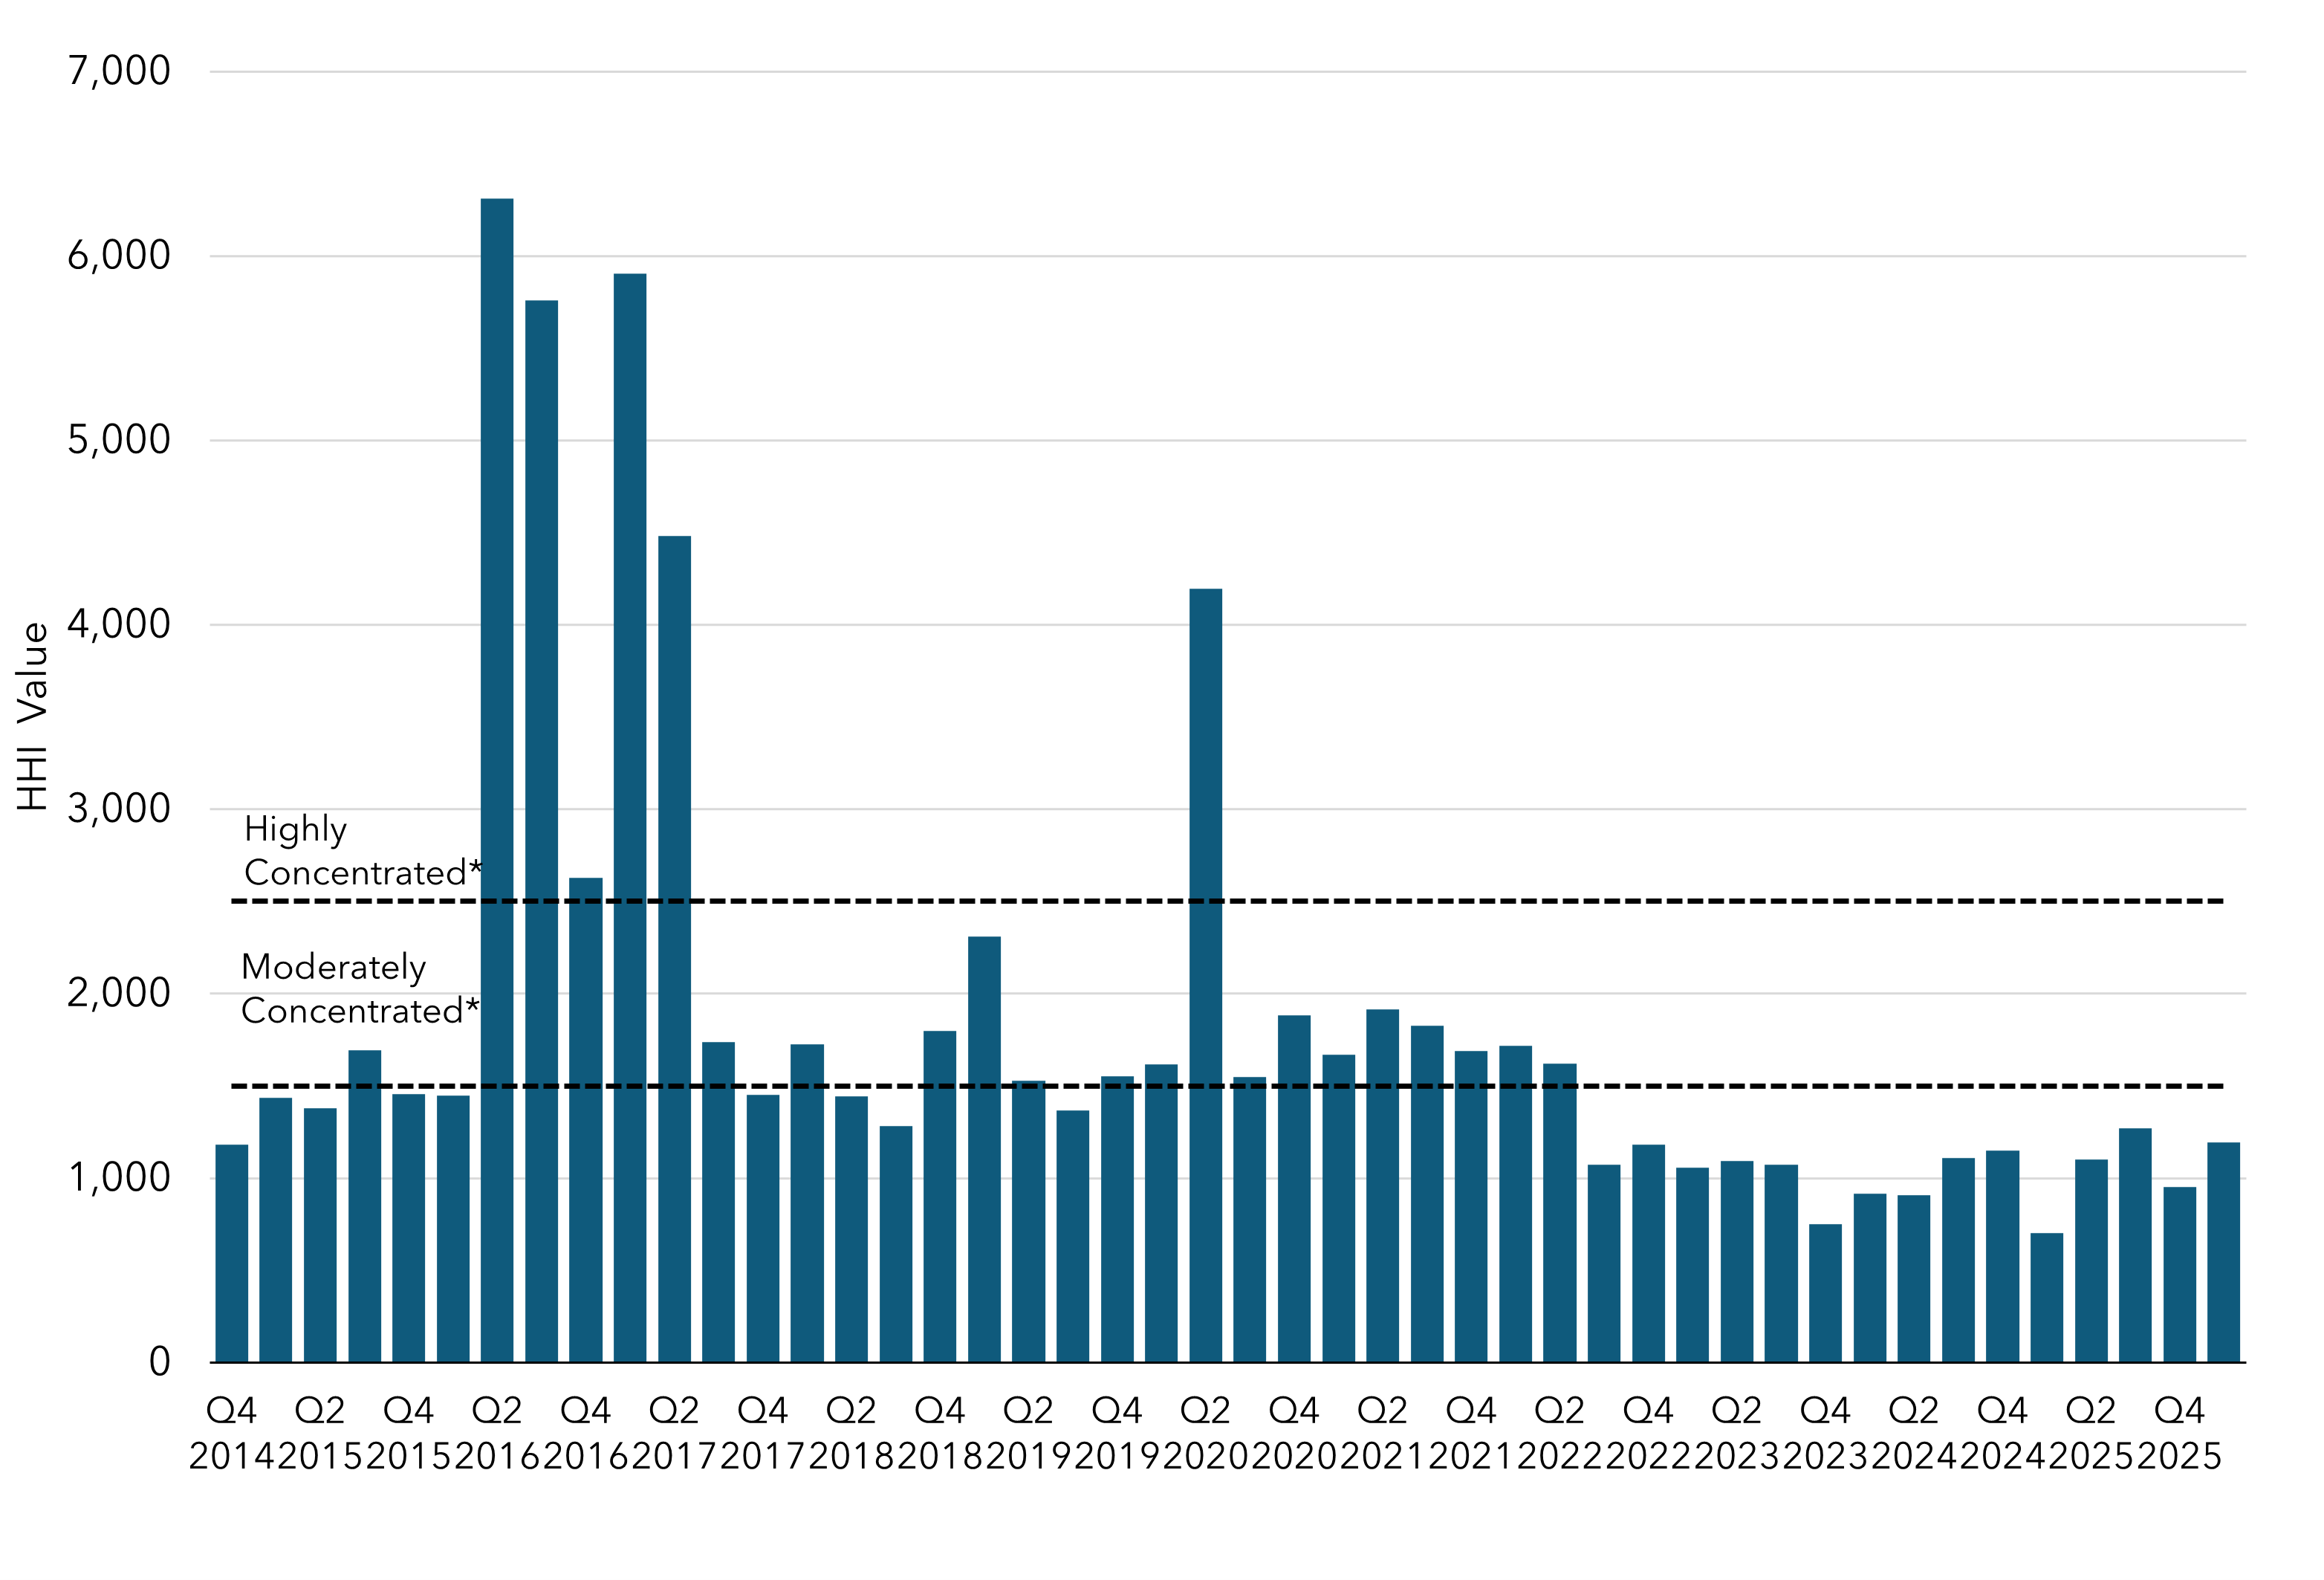
Herfindahl-Hirschman Index Values for Current Auctions
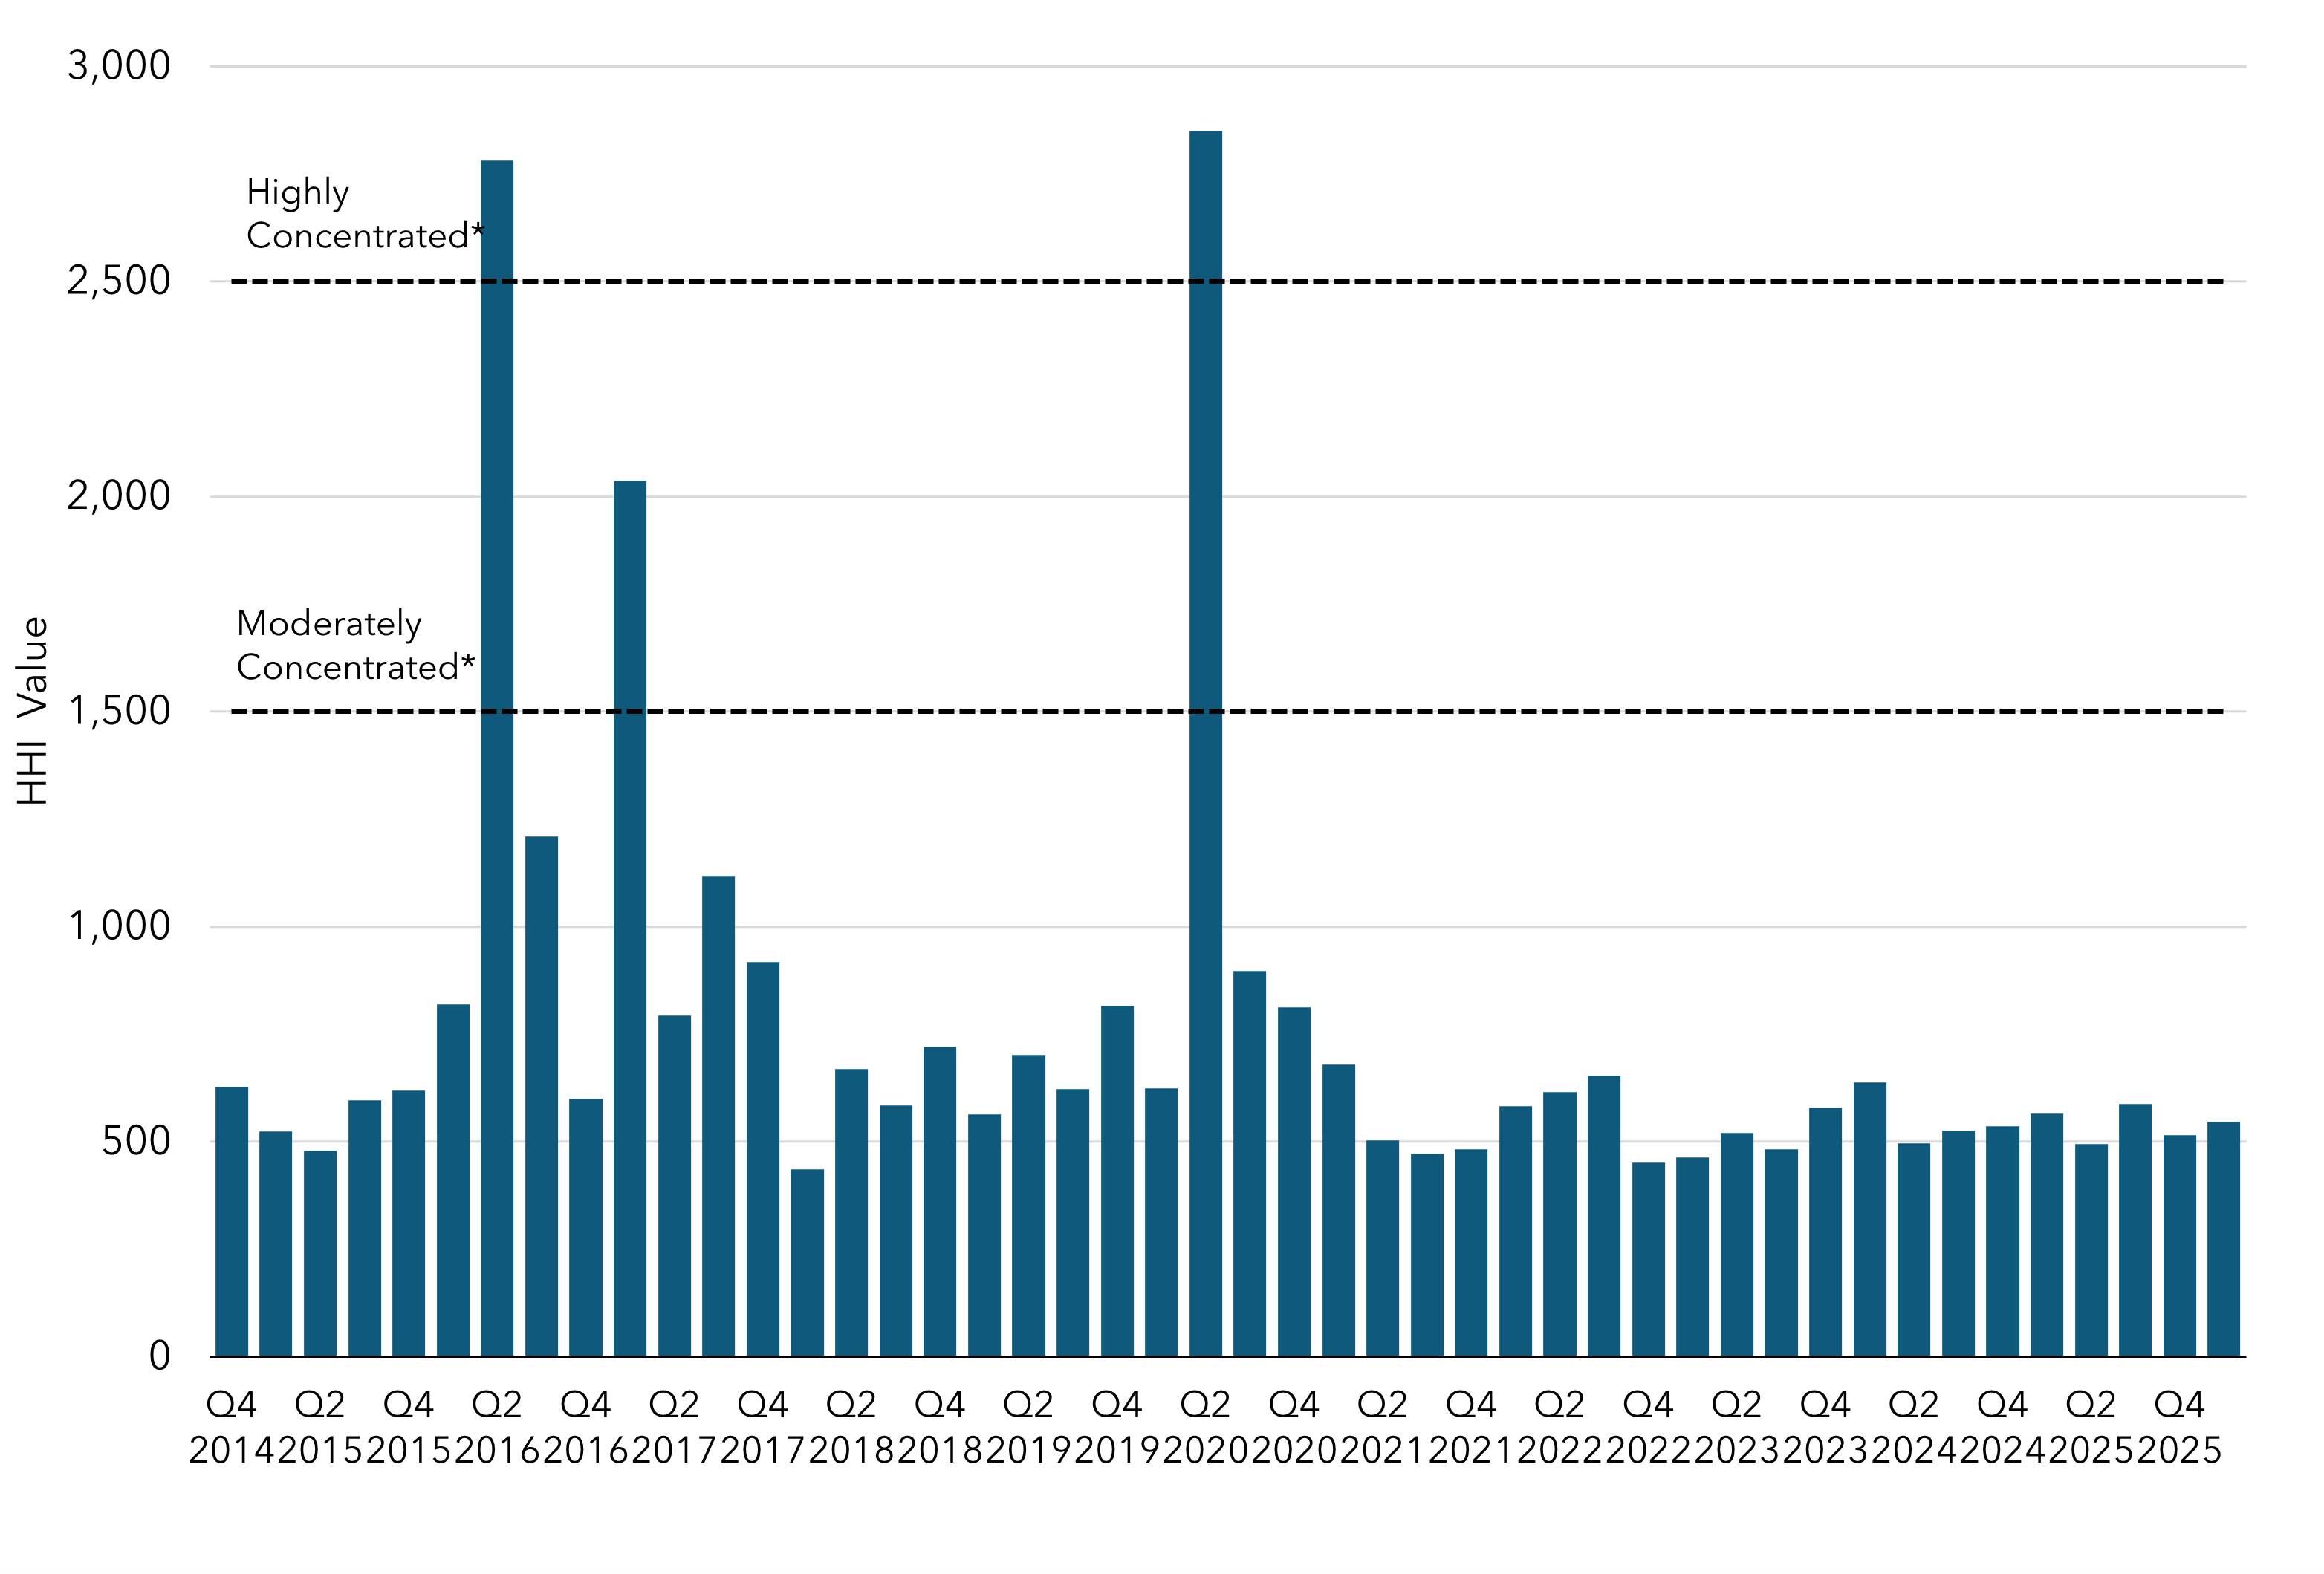
The Herfindahl-Hirschman Index (HHI) is a common measure of market concentration used to express competitiveness. Lower HHI values are desirable as they indicate a greater number of participants were successful and competitive. Higher HHI values indicate fewer participants were successful representing a less competitive outcome.
* Highly Concentrated (HHI > 2,500) and Moderately Concentrated (1,500 < HHI < 2,500) ranges from the U.S. Department of Justice.
Download chart data (includes both Current Auctions and Advance Auctions HHI values). For more information see Summary Results Reports at Auction Notices and Reports.
Herfindahl-Hirschman Index Values for Advance Auctions
* Highly Concentrated (HHI > 2,500) and Moderately Concentrated (1,500 < HHI < 2,500) ranges from the U.S. Department of Justice.
Download chart data (includes both Current Auctions and Advance Auctions HHI values). For more information see Summary Results Reports at Auction Notices and Reports.
Allocation Data
Vintage 2026 Allowance Allocation
Download chart data. Other includes all industrial sectors listed in the Vintage 2026 Allowance Allocation Summary not otherwise listed in this chart, plus legacy contract generators, universities, public service facilities, and public wholesale water agencies.
For more information see Vintage 2026 Allowance Allocation Summary and Allowance Allocation.
Vintage 2024 Industrial Allocation and 2024 Emissions

Download chart data. Other includes all industrial sectors listed in the Vintage 2026 Allowance Allocation Summary not otherwise listed in this chart, plus legacy contract generators, universities, public service facilities, and public wholesale water agencies to protect confidential data. Industrial and utility allocation data can be found at the Program Data webpage. Facility level emissions data can be found on the MRR Data webpage.
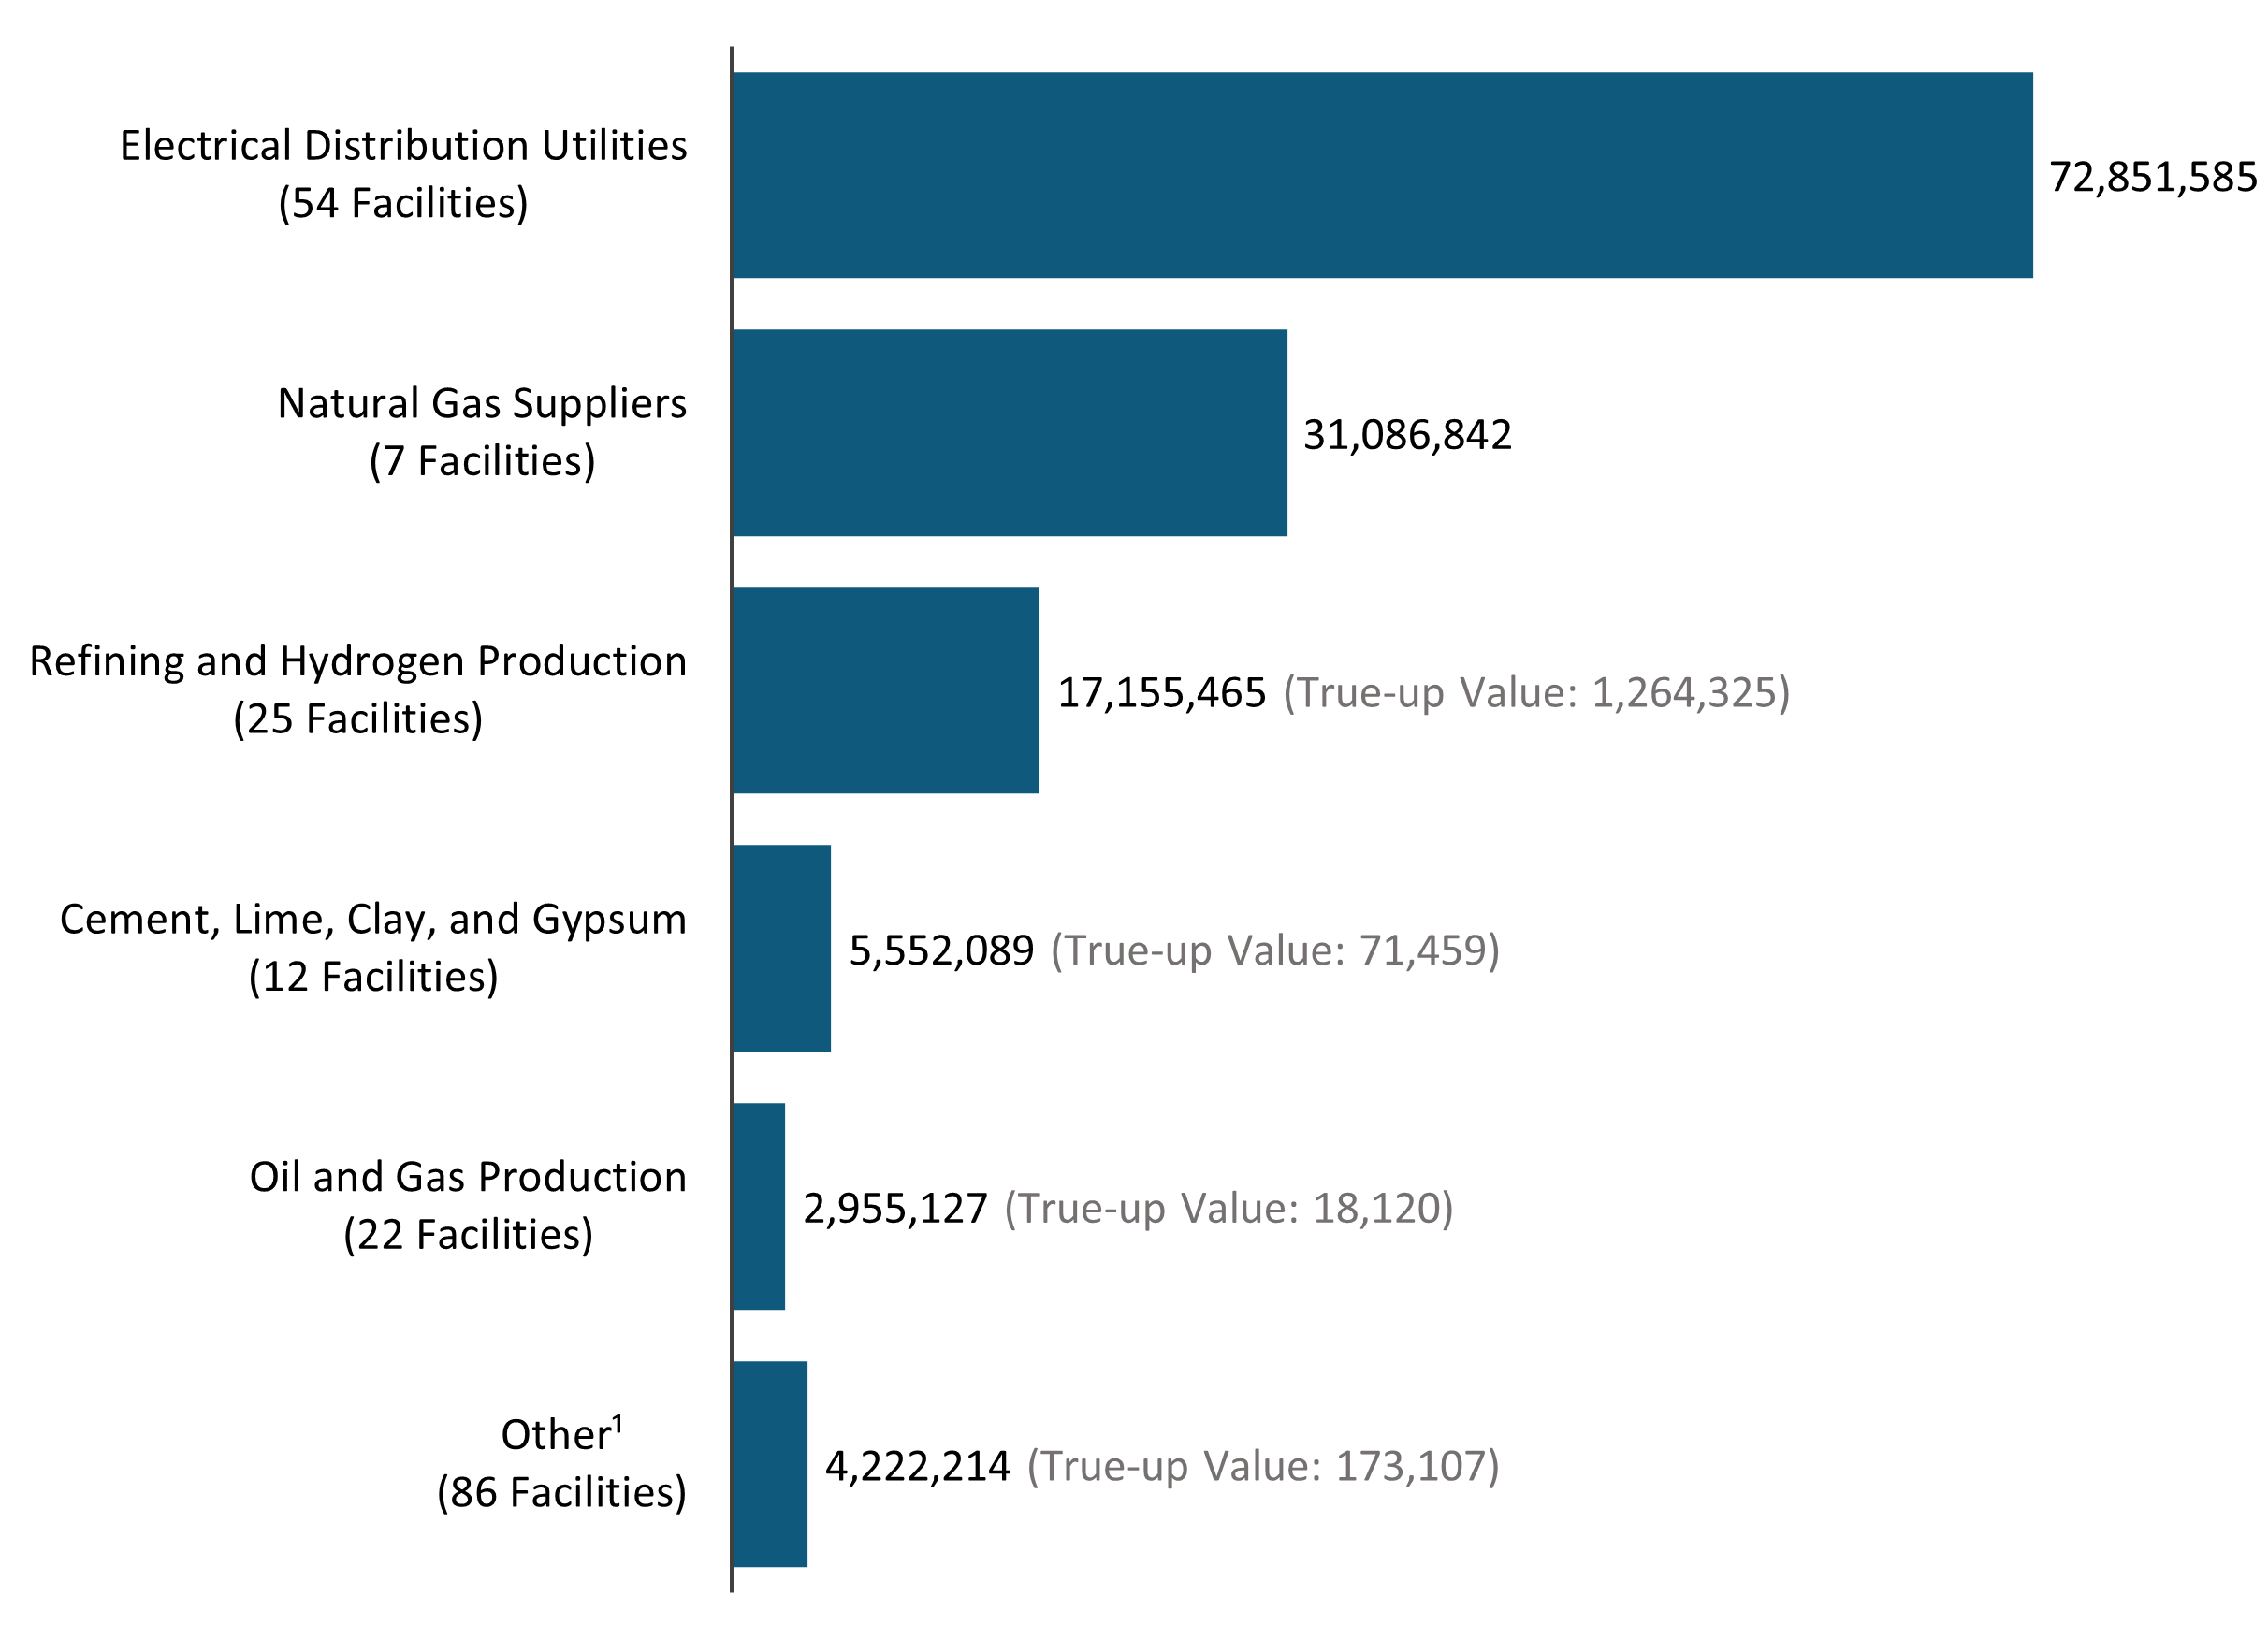
Electrical Distribution Utility Use of Allocated Allowance Value in 2013-2023 (Total = $16B)

Download chart data. Residential Return and Industry and Small Business Returns include volumetric and non-volumetric returns. For Investor-owned utilitiess, the Residential Return is the California Climate Credit, and the Industry Return is the California Industry Assistance Credit. Effective April 1, 2019, purchasing allowances with allocated allowance value is prohibited. For more information, see Electrical Distribution Utility and Natural Gas Supplier Allowance Allocation.
Natural Gas Supplier Use of Allocated Allowance Value in 2015-2023 (Total = $6.9B)

Download chart data. For Investor-owned utilitiess, the Residential Return is the California Climate Credit. Effective April 1, 2019, purchasing allowances or netting Natural Gas Supplier allowance value against Program compliance costs is prohibited.
For more information, see Electrical Distribution Utility and Natural Gas Supplier Allowance Allocation.
Offset Data
ARB Offset Credit Issuance
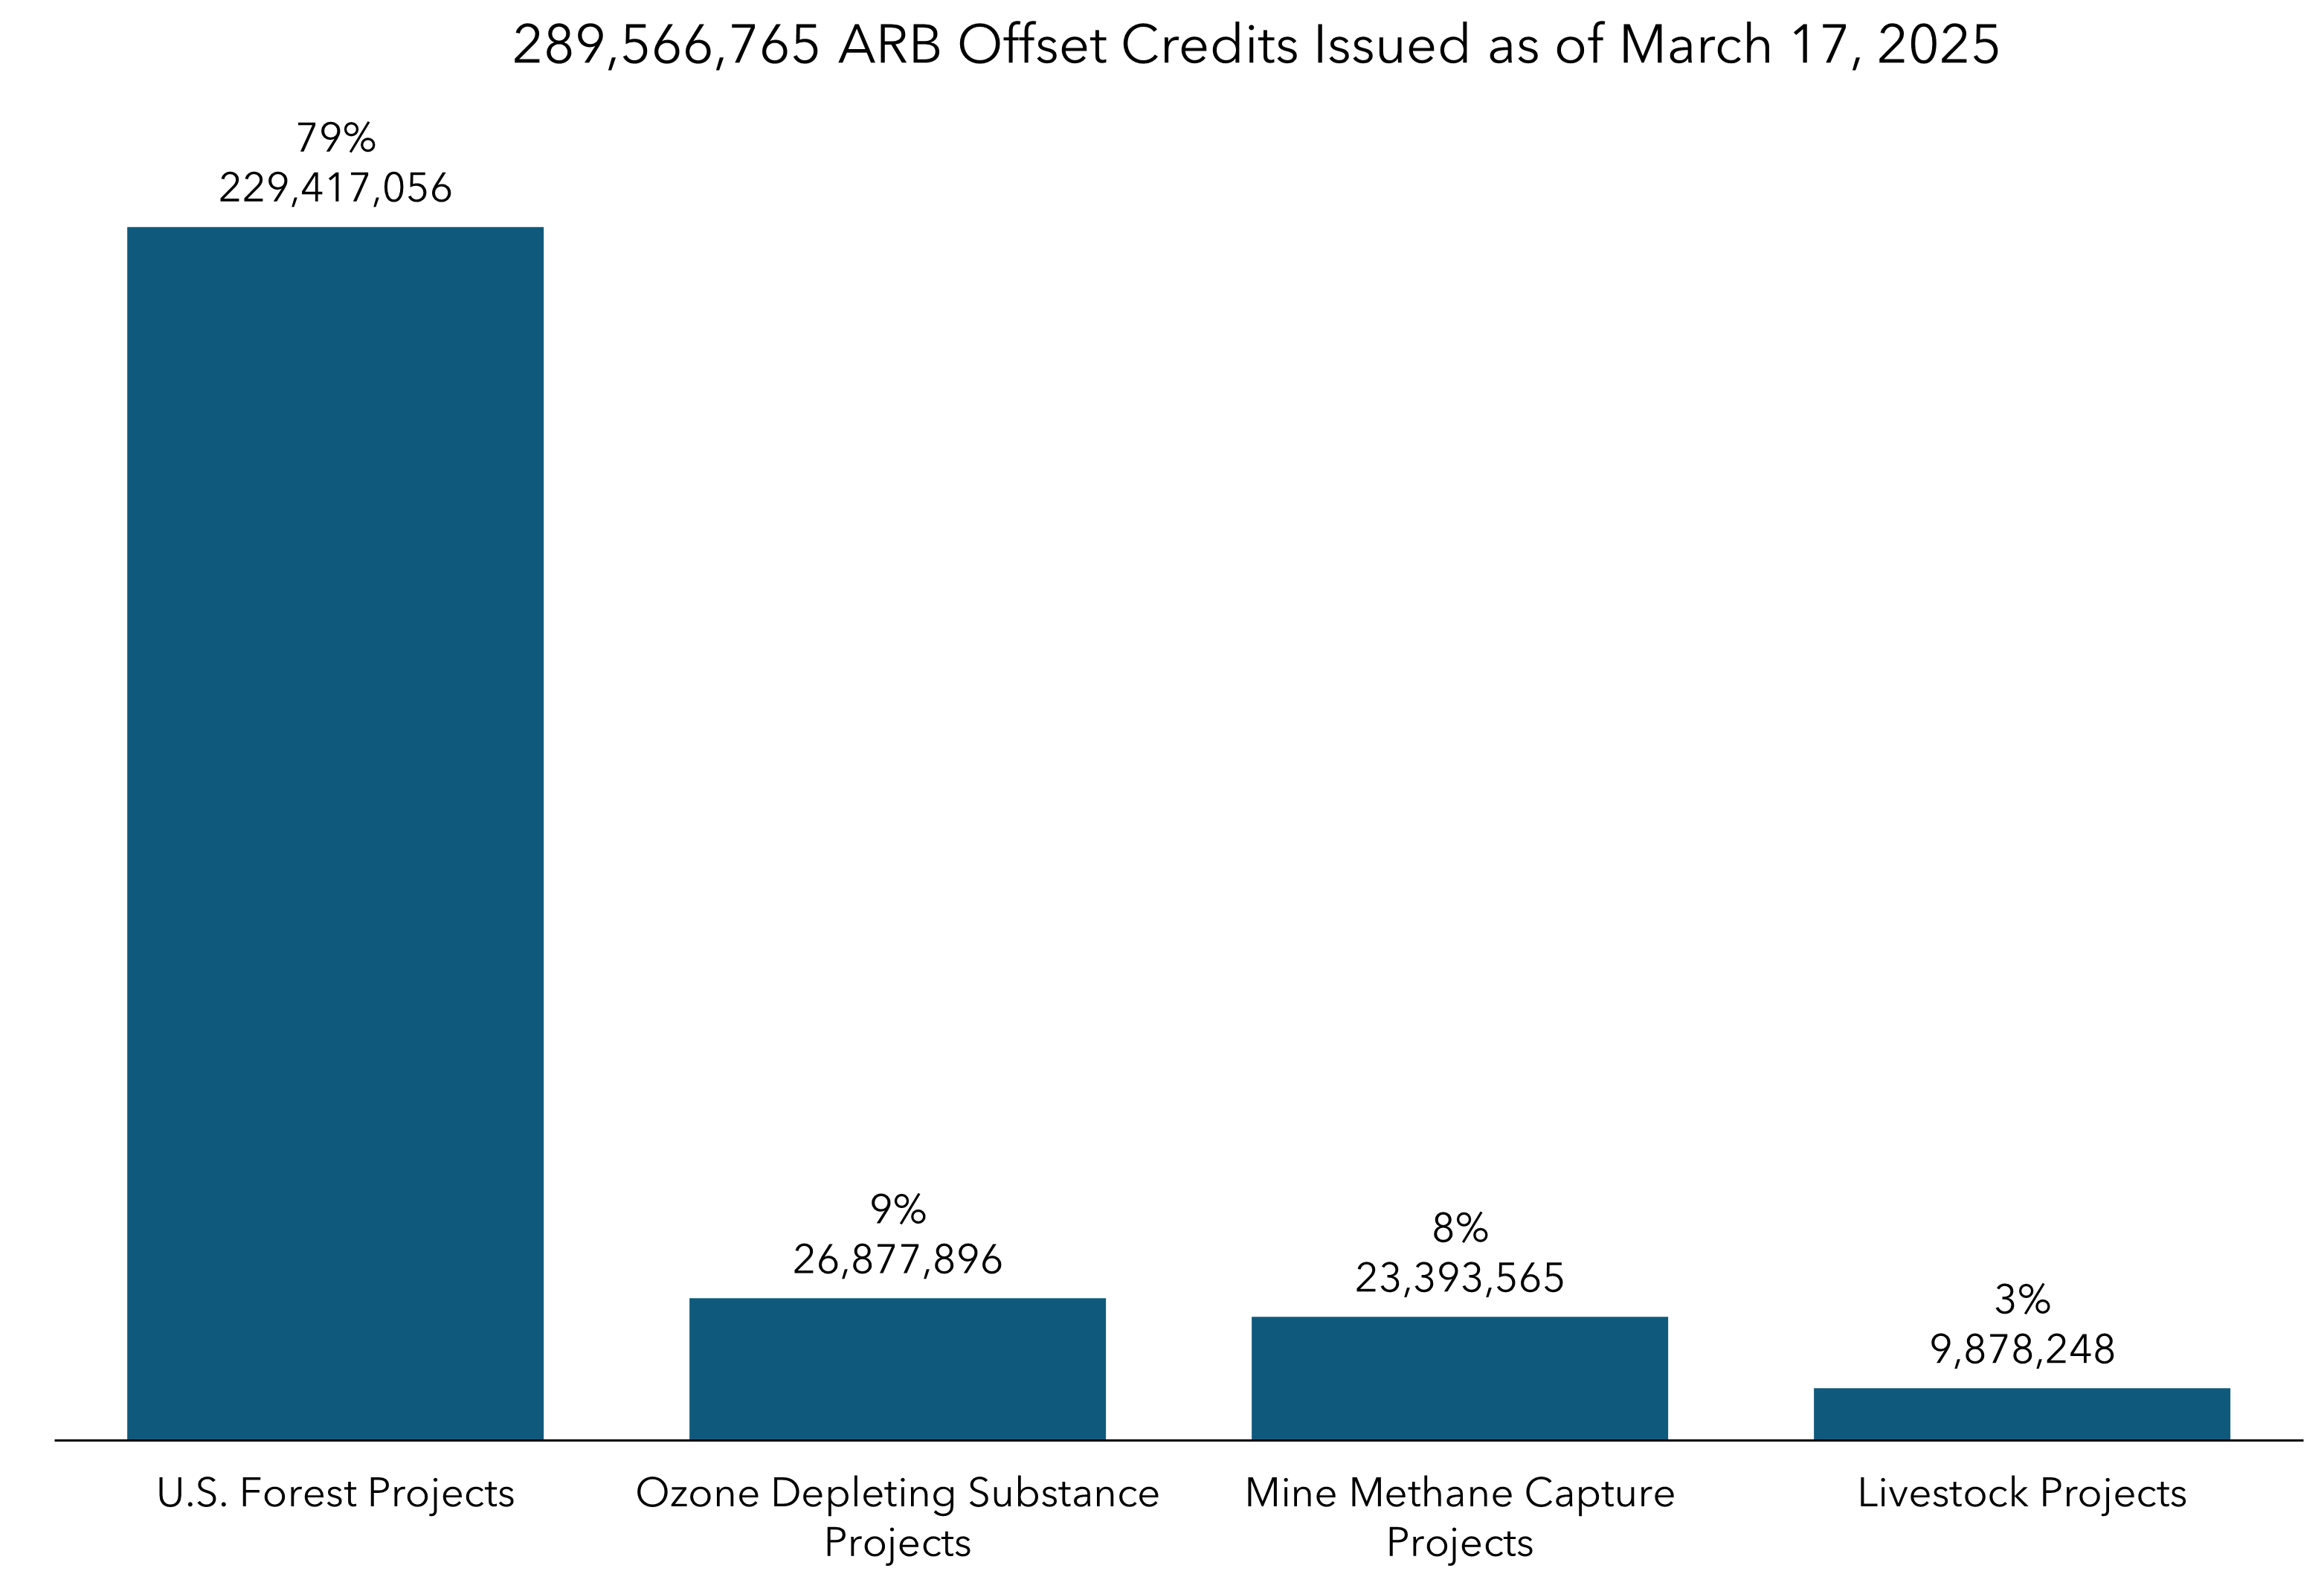
For more information see ARB Offset Credit Issuance Table and Compliance Offset Program.
Forest Buffer Account Balance Over Time
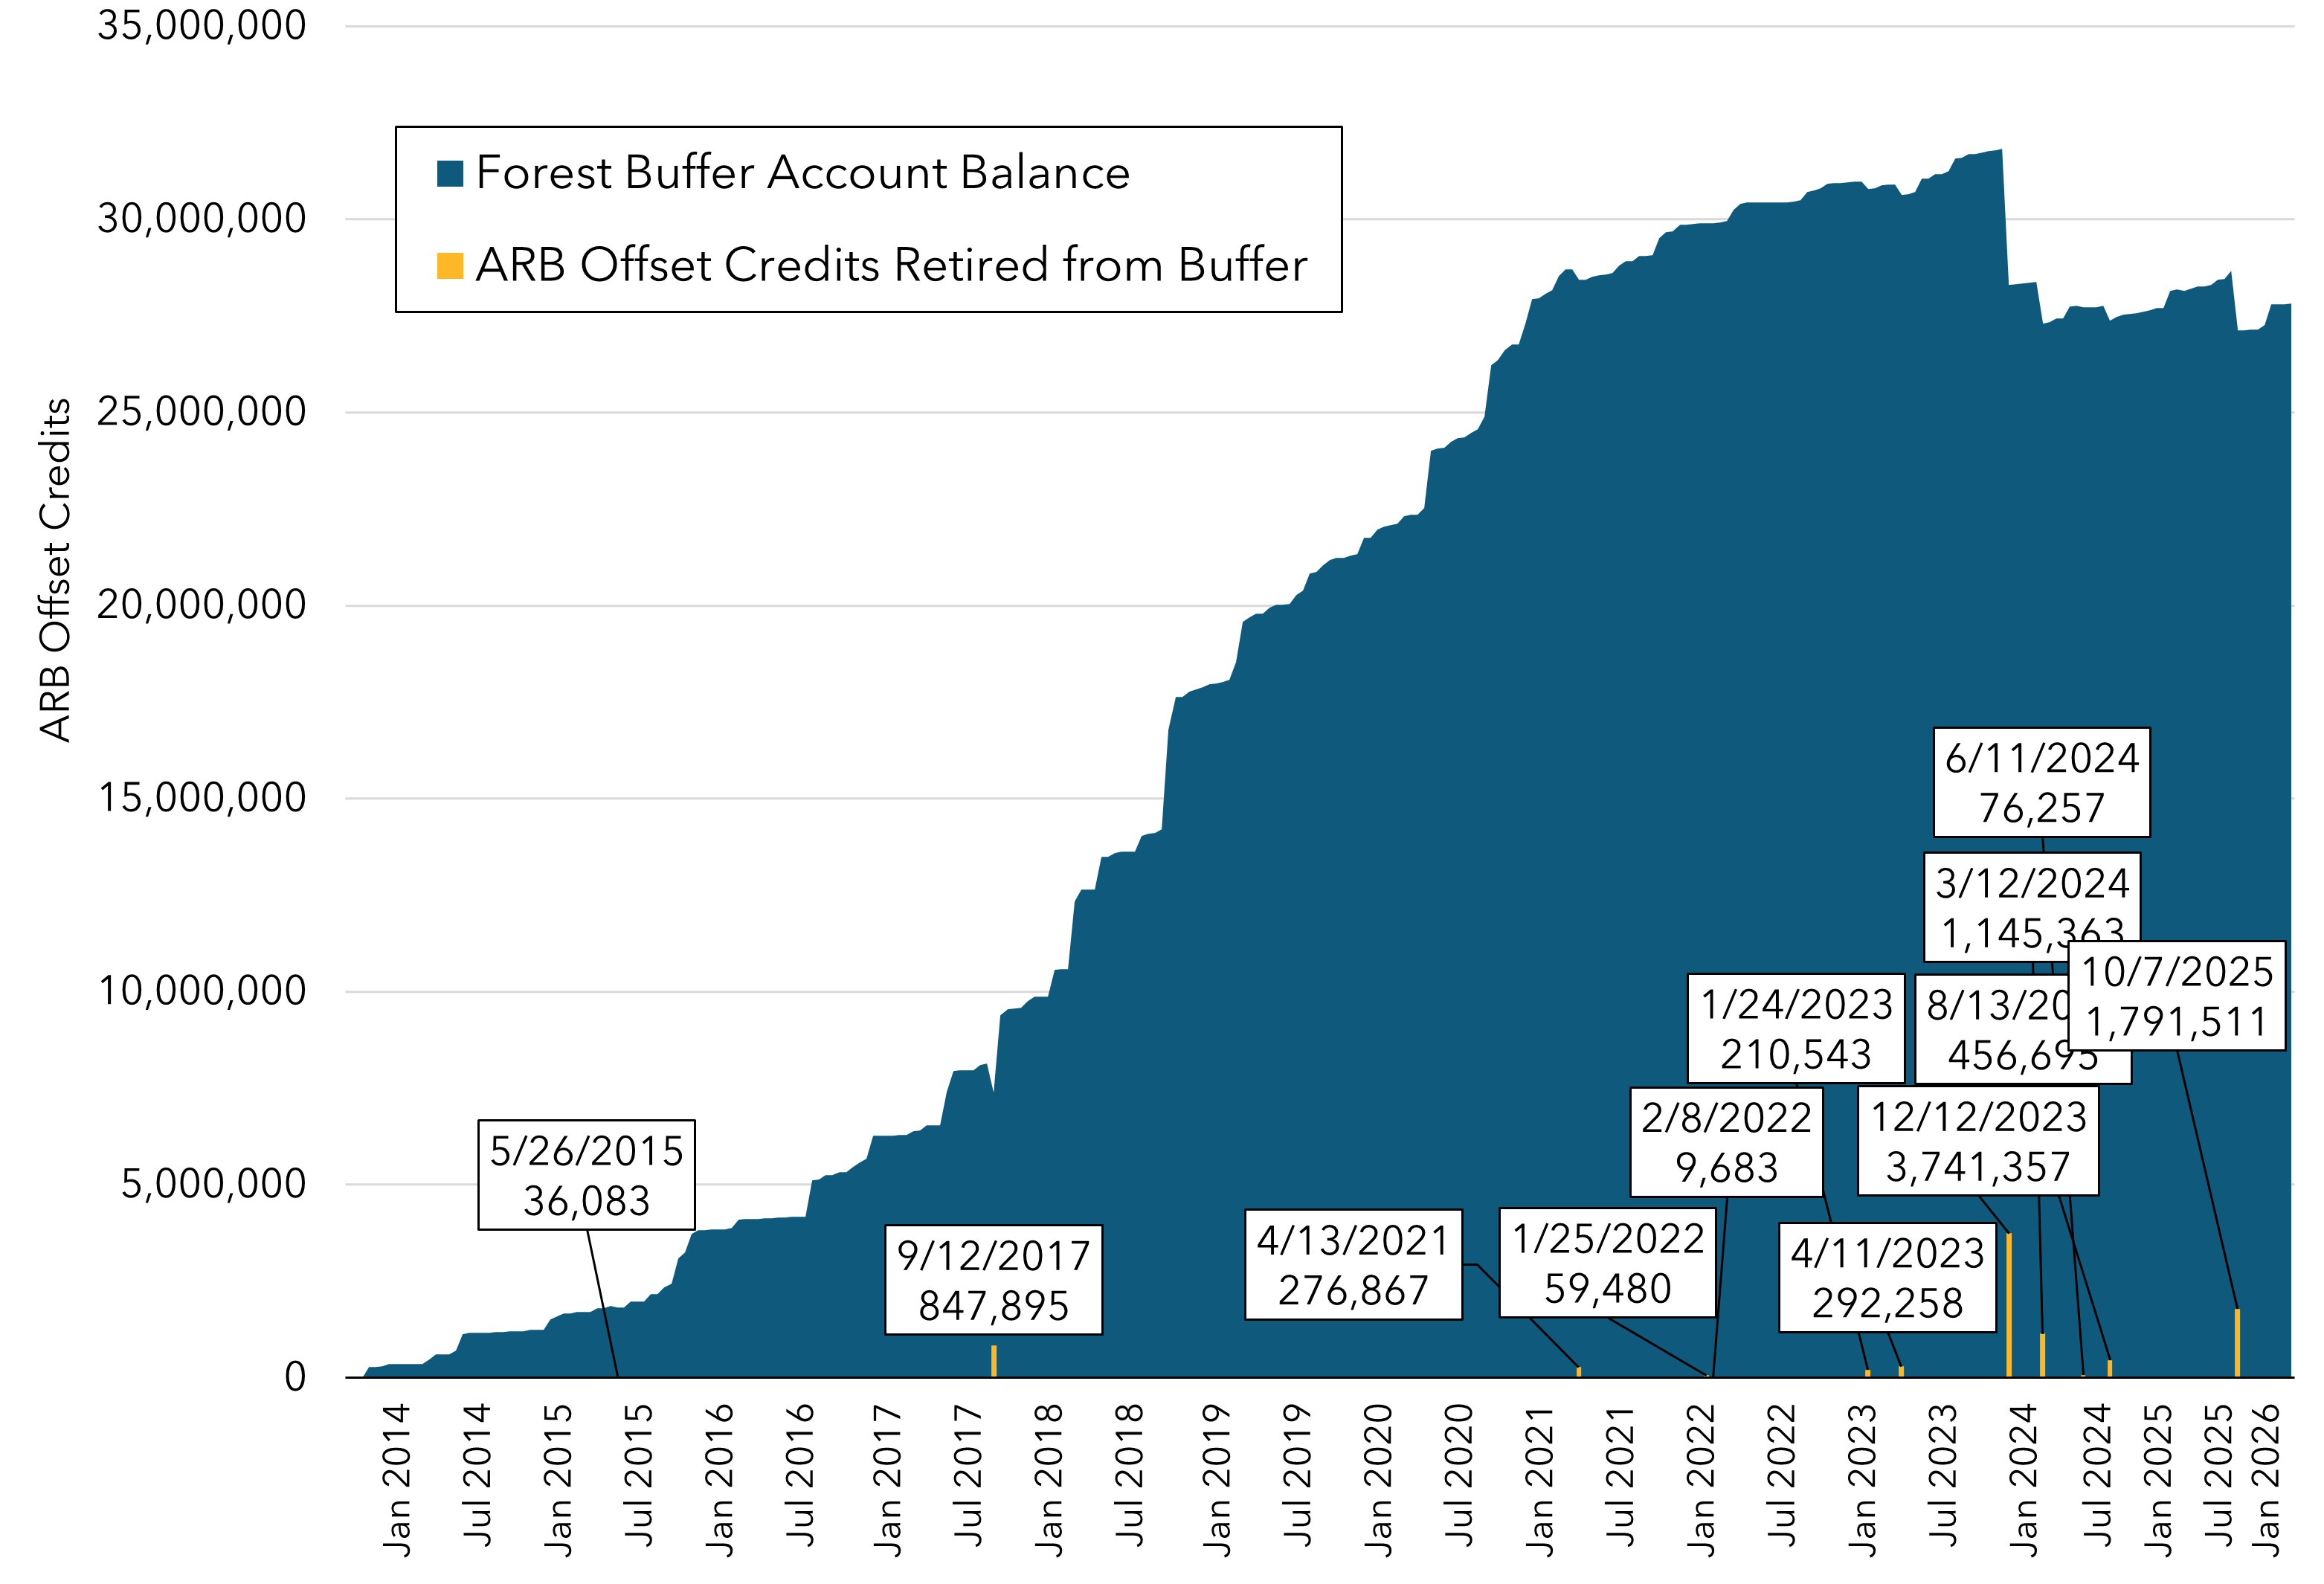
Download chart data. The Forest Buffer Account is a general insurance mechanism against unintentional reversals for ARB offset credits issued to forest offset projects. For more information see California's Compliance Offset Program FAQ.
Market Activity Data
Summary of Market Transfers by Year
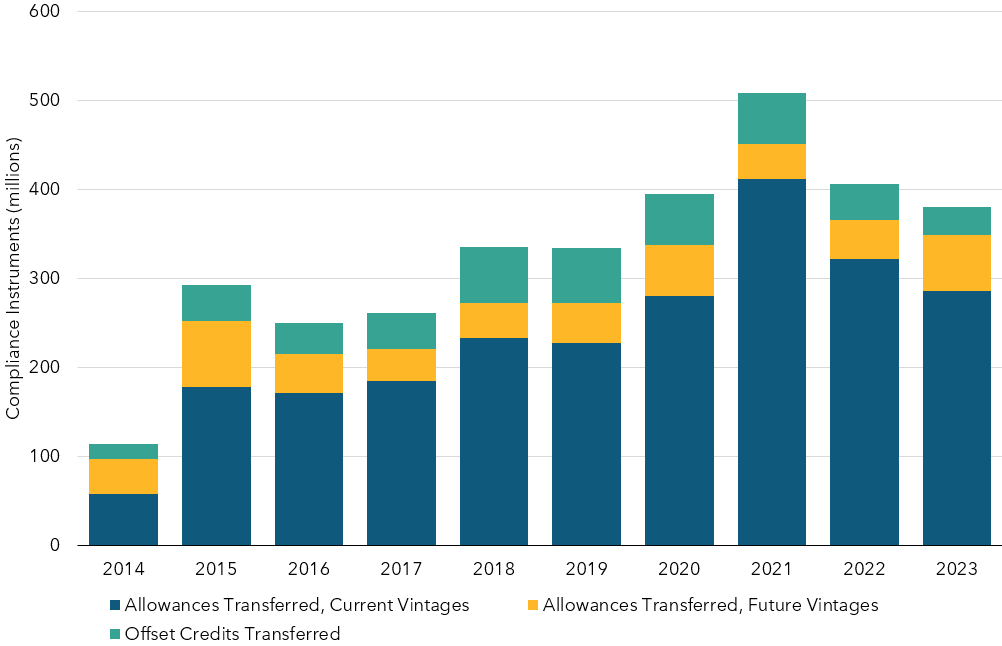
Download chart data. For more information see Summary of Market Transfers Report.
Summary of Market Transfers by Quarter
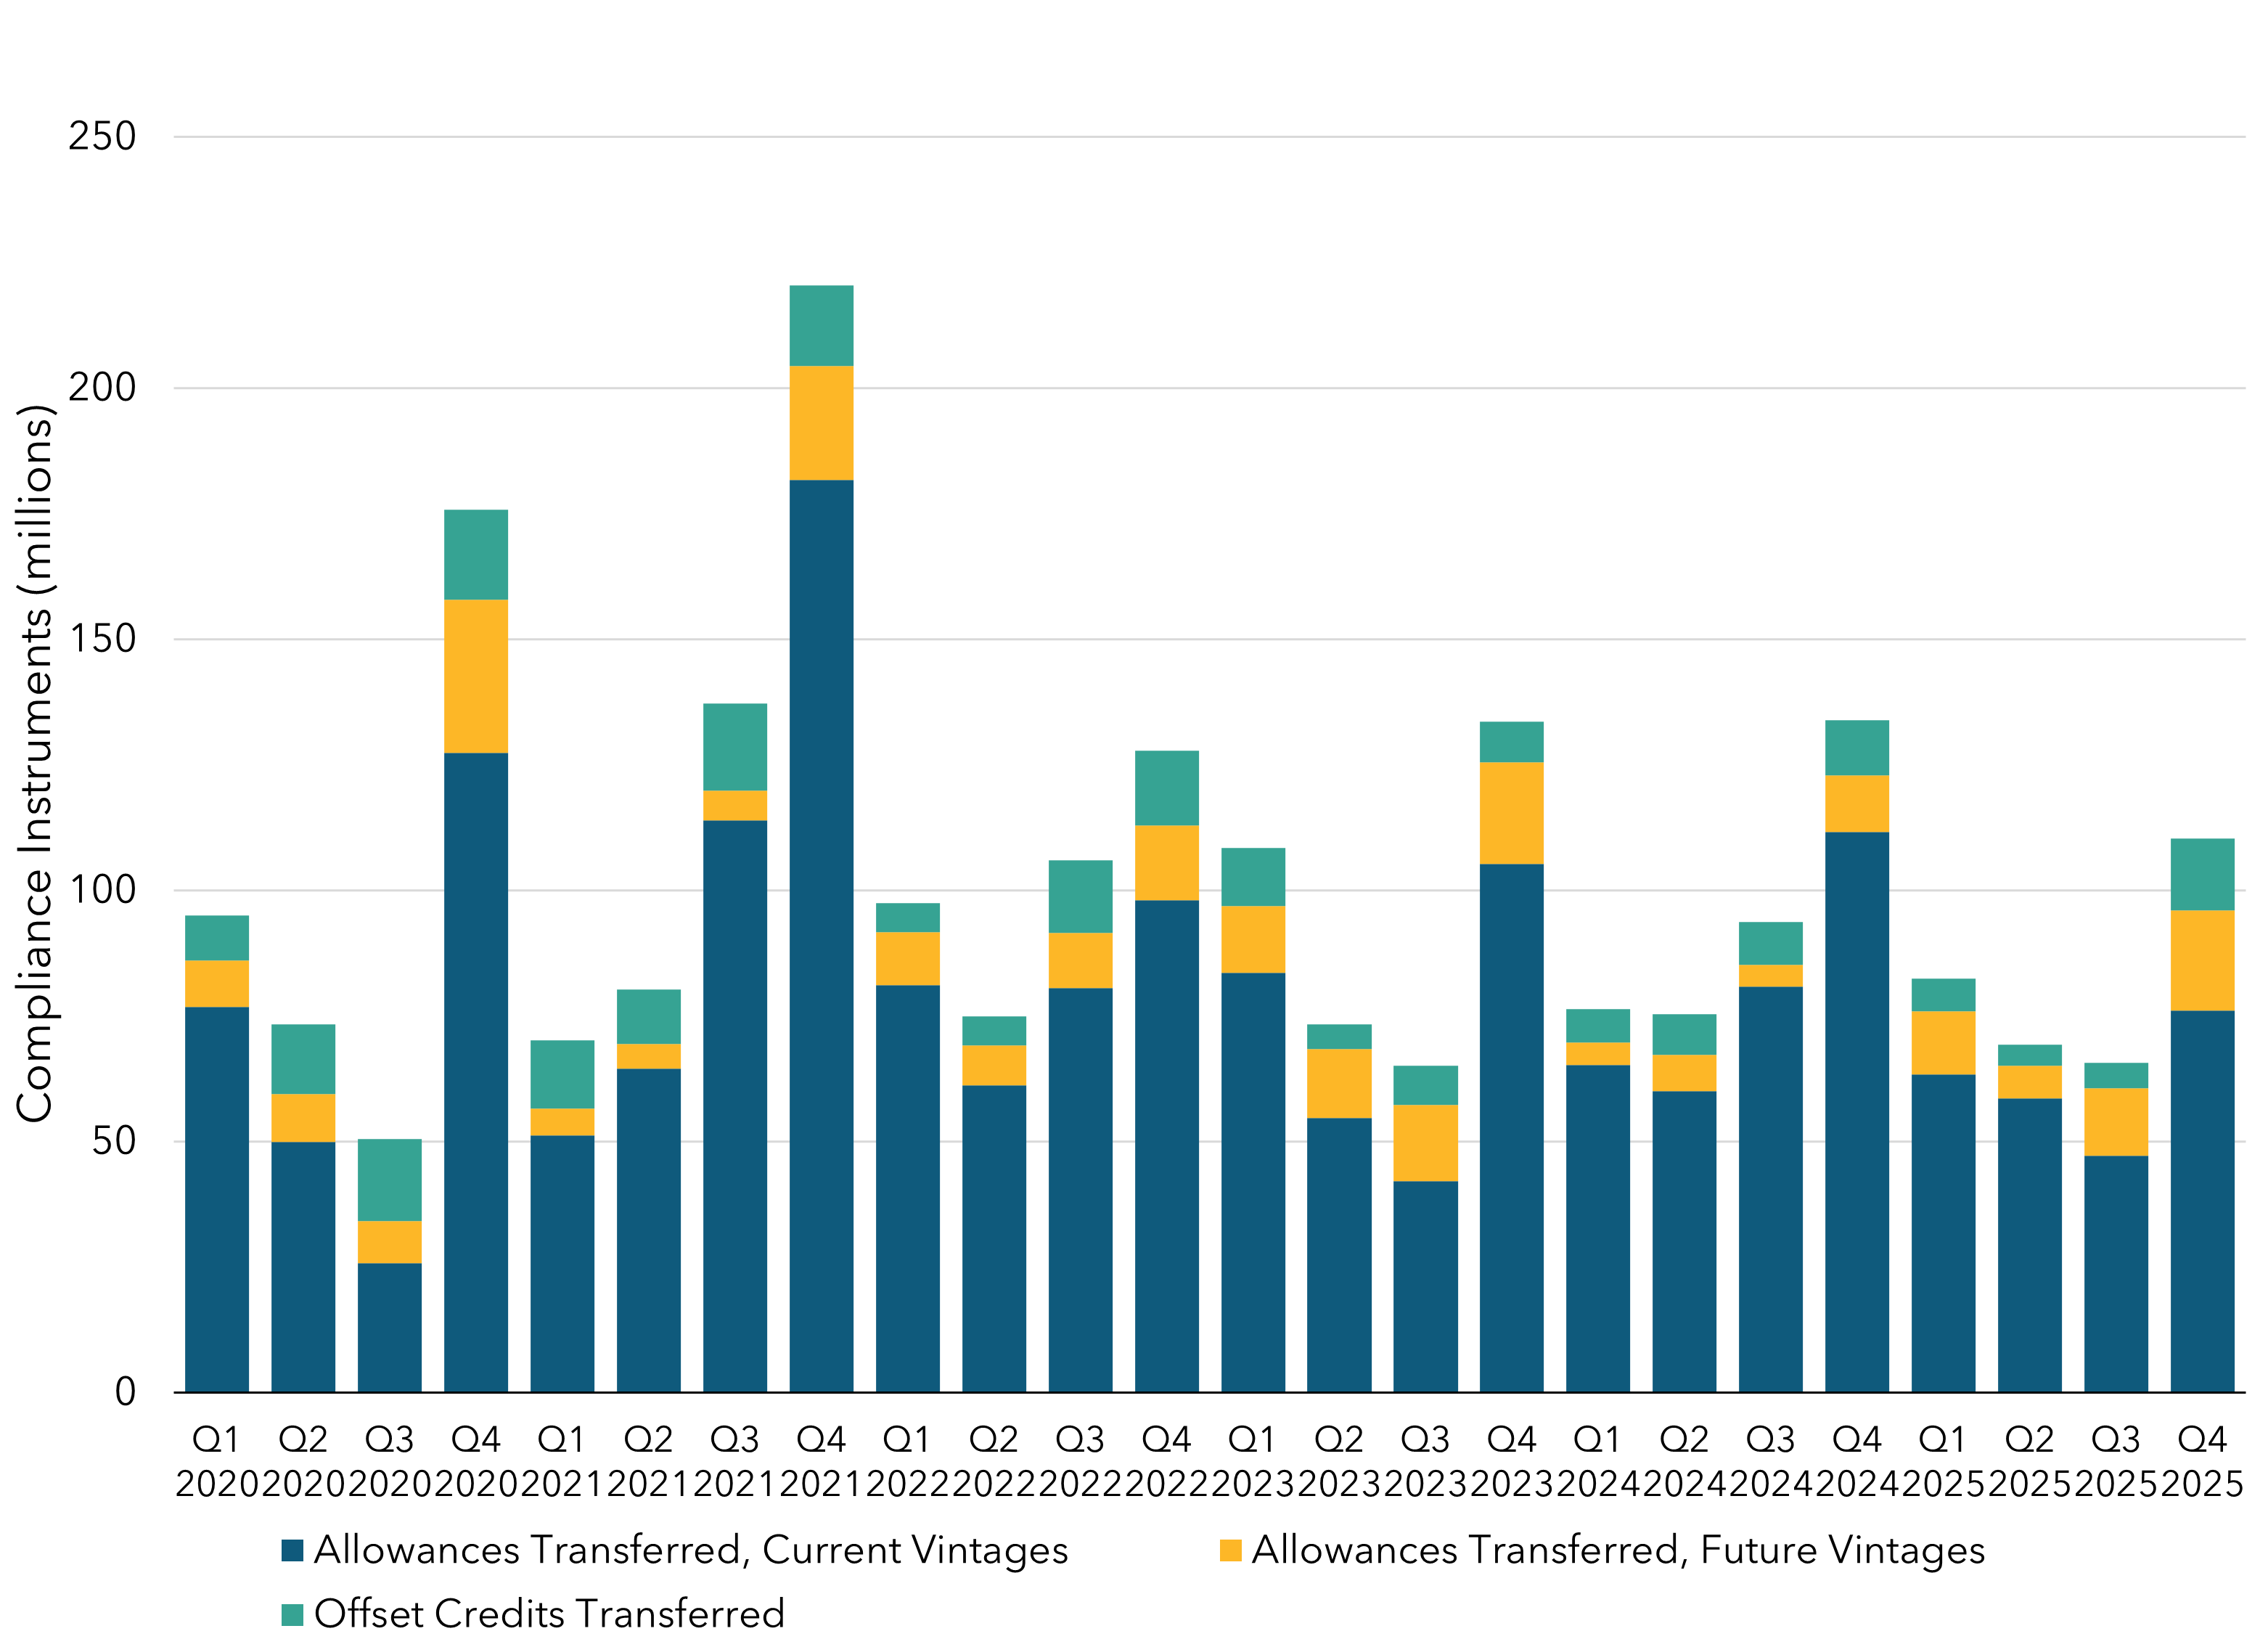
Download chart data. For more information see Summary of Market Transfers Report.
VRE Program
Voluntary Renewable Electricity (VRE) Program Allowance Retirements by Generation Year
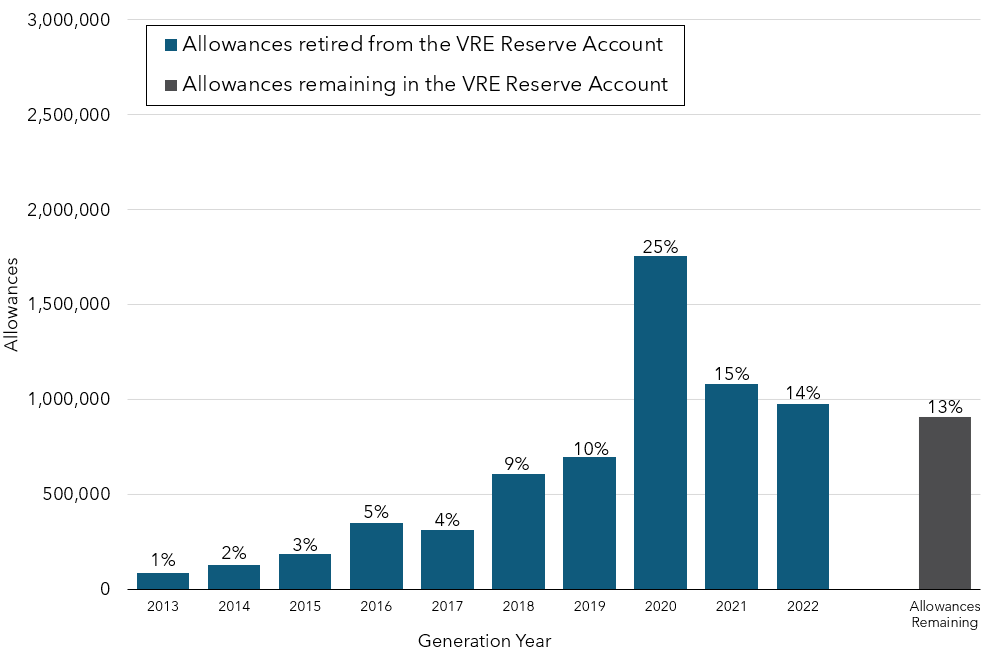
Download allowances retired data and allowances remaining data. For more information see Voluntary Renewable Electricity Program.