Enforcement Data - Compliance Summary
Contact
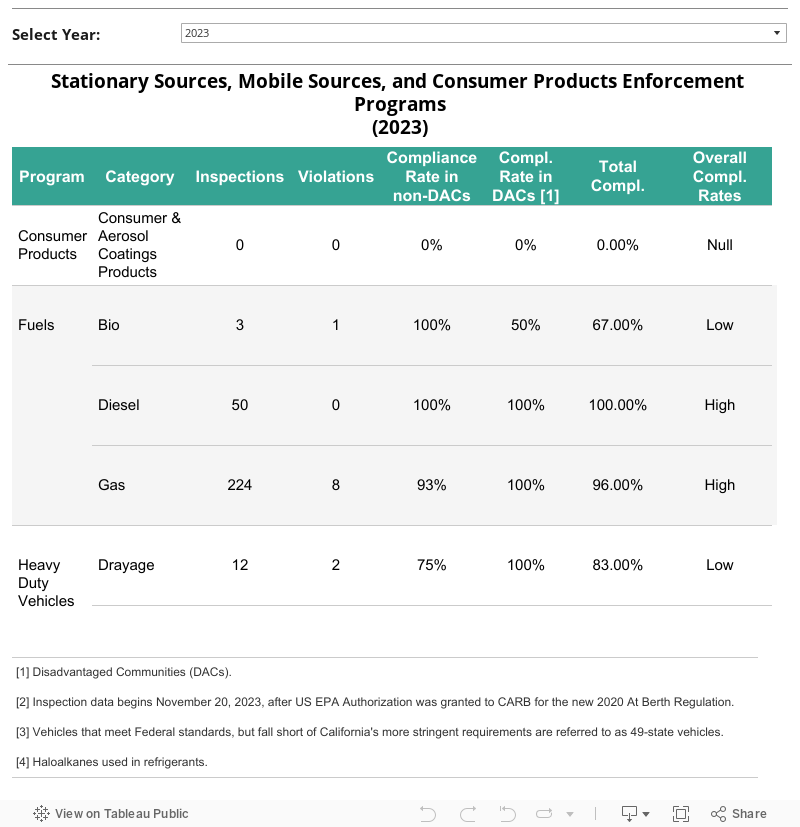
The table below shows compliance rates by program compiled from inspection data in EDVS. Compliance rates are provided for all inspections and for disadvantaged communities (DAC). These compliance rates do not incorporate information obtained through other avenues, such as in-use compliance testing, that may find noncompliance that cannot be identified through inspection. Compliance rates above 95% are considered high, rates between 85% and 95% are considered medium, and rates below 85% are considered low. The compliance numbers in the table below were compared against other CARB program estimates (e.g. EMFAC, in-use compliance, off-road, and regulatory teams), which confirmed the qualitative rating.
In 2022, inspections were not performed on cargo handling equipment (CHE) and large spark ignition engines (LSI). Historically, CHE and LSI engines have high compliance rates and so, for 2022, staff focused on other program areas with lower compliance. Finally, shore power compliance rates are typically behind by one year as the data that is reported to CARB for compliance determination is not available until the following year.
Stationary Sources, Mobile Sources, and Consumer Products Enforcement Programs (2022)
Program Category | Inspections | Violations | Compliance Rate in non-DACs | Compliance Rate in DACs1 | Total Compliance | Overall Compliance Rates |
---|---|---|---|---|---|---|
Consumer Products | ||||||
Consumer & Aerosol Coatings Products | 3 | 0 | 100% | 100% | 100% | High |
Fuels | ||||||
Diesel | 42 | 0 | 100% | N/A | 100% | High |
Gas | 241 | 12 | 100% | 89% | 95% | High |
Heavy-Duty Vehicles | ||||||
Drayage Trucks | 67 | 0 | 100% | 100% | 100% | High |
HDVIP - Diesel Exhaust Fluid2 | 22 | 0 | 100% | 100% | 100% | High |
HDVIP - Emission Control Label | 1260 | 148 | 89% | 88% | 88% | Medium |
HDVIP - Smoke Opacity | 1074 | 129 | 92% | 83% | 88% | Medium |
HDVIP - Tampering | 720 | 97 | 89% | 82% | 87% | Medium |
Idling | 6501 | 139 | 98% | 98% | 98% | High |
Off-Road | 282 | 60 | 78% | 80% | 79% | Low |
Smart-Way | 59 | 1 | 98% | 100% | 98% | High |
SWC3 | 3 | 0 | N/A | 100% | 100% | High |
Transport Refrigeration Units | 906 | 493 | 58% | 38% | 46% | Low |
Truck and Bus | 1147 | 56 | 96% | 93% | 95% | High |
Railroad & Marine | ||||||
Cargo Handling Equipment | 0 | 0 | 0% | 0% | 0% | N/A |
Commercial Harbor Craft | 24 | 0 | N/A | 100% | 100% | High |
Ocean Going Vessel Fuels | 347 | 12 | 100% | 96% | 97% | High |
Shore Power4 | 33 | 7 | 75% | 79% | 79% | Low |
Transport Refrigeration Units | 581 | 14 | N/A | 98% | 98% | High |
Stationary Source | ||||||
Landfills | 18 | 14 | 8% | 60% | 22% | Low |
Oil and Gas | 10 | 9 | 0% | 33% | 10% | Low |
Vehicles & Engines | ||||||
49 State Vehicles5 | 124 | 9 | 91% | 95% | 93% | Medium |
Automotive Windshield Washer Fluid | 9 | 0 | 100% | 100% | 100% | High |
Dealer & Fleet Tampering | 145 | 4 | 96% | 99% | 97% | High |
Electric Vehicle Supply Equipment | 10 | 0 | 100% | 100% | 100% | High |
Large Spark Ignition Engines | 0 | 0 | 0% | 0% | 0% | N/A |
Motorcycles | 25 | 0 | 100% | 100% | 100% | High |
Off-Highway Recreational Vehicles | 46 | 6 | 89% | 75% | 87% | Medium |
Portable Fuel Containers | 344 | 0 | 100% | 100% | 100% | High |
R134A6 | 113 | 0 | 100% | 100% | 100% | High |
Recreational Marine Engines | 13 | 1 | 88% | 100% | 92% | Medium |
Recreational Marine - Evaporation | 27 | 11 | 62% | 50% | 59% | Low |
Small Off-Road Engines | 406 | 3 | 99% | 100% | 99% | High |
The table below provides historical EDVS compliance rates for programs with low inspection numbers (less than 20) or when laboratory/audit results are not yet available for 2022. In most cases compliance is estimated from data obtained between 2015 to 2022, however, some programs do not have data in certain years due to lack of inspections, a later start date to the program or when record keeping requirements were implemented. Compliance rates are provided for all inspections and for disadvantaged communities (DAC). These compliance rates do not incorporate information obtained through other avenues, such as in-use compliance testing, that may find noncompliance that cannot be identified through inspection. Compliance rates above 95% are considered high, rates between 85% and 95% are considered medium, and rates below 85% are considered low.
Stationary Sources, Mobile Sources, and Consumer Products Enforcement Programs (2015-2022)
Program Category | Inspections | Violations | Compliance Rate in non-DACs | Compliance Rate in DACs | Total Compliance | Overall Compliance Rates |
---|---|---|---|---|---|---|
Consumer Products | ||||||
Aerosol Coatings | 105 | 36 | 60% | 80% | 66% | Low |
Antiperspirants / Deodorants | 28 | 5 | 82% | 82% | 82% | Low |
Composite Wood | 125 | 55 | 44% | 77% | 56% | Low |
Consumer Products | 1,431 | 156 | 89% | 90% | 89% | Medium |
Fuels | ||||||
Diesel | 1,328 | 1 | 100% | 100% | 100% | High |
Gas | 5,595 | 50 | 100% | 98% | 99% | High |
Heavy Duty Vehicles | ||||||
Drayage Trucks | 4,026 | 254 | 78% | 95% | 94% | Medium |
HDVIP - Diesel Exhaust Fluid | 1,634 | 0 | 100% | 100% | 100% | High |
HDVIP - Emission Control Label | 26,458 | 1,999 | 93% | 91% | 92% | Medium |
HDVIP - Smoke Opacity | 25,925 | 489 | 98% | 98% | 98% | High |
HDVIP - Tampering | 8,654 | 641 | 92% | 94% | 93% | Medium |
Idling | 48,044 | 2,214 | 95% | 96% | 95% | High |
Off-Road | 9,950 | 1,651 | 84% | 81% | 83% | Low |
Smart-Way | 5,893 | 723 | 88% | 87% | 88% | Medium |
SWC | 183 | 30 | 80% | 90% | 84% | Low |
Transport Refrigeration Units | 13,847 | 6,154 | 63% | 47% | 56% | Low |
Truck and Bus | 40,664 | 7,439 | 80% | 84% | 82% | Low |
Railroad & Marine | ||||||
Cargo Handling Equipment | 3,912 | 523 | 100% | 86% | 87% | Medium |
Commercial Harbor Craft | 823 | 55 | 89% | 96% | 93% | Medium |
Ocean Going Vessel Fuels | 4,575 | 76 | 99% | 98% | 98% | High |
Transport Refrigeration Units | 2,138 | 14 | 100% | 99% | 99% | High |
Stationary Source | ||||||
Landfills | 31 | 22 | 26% | 38% | 29% | Low |
Oil and Gas | 20 | 16 | 11% | 27% | 20% | Low |
Vehicles & Engines | ||||||
49 State Vehicles | 947 | 82 | 92% | 90% | 91% | Medium |
Dealer & Fleet Tampering | 867 | 29 | 95% | 97% | 97% | High |
Large Spark Ignition Engine | 35 | 0 | 100% | 100% | 100% | High |
Motorcycles | 63 | 2 | 96% | 100% | 97% | High |
Off-Highway Recreational Vehicles | 244 | 12 | 96% | 92% | 95% | High |
Portable Fuel Containers | 1,191 | 20 | 98% | 98% | 98% | High |
R134A | 981 | 28 | 97% | 97% | 97% | High |
Recreational Marine Engines | 123 | 11 | 92% | 88% | 91% | Medium |
Small Off-Road Engines | 1,909 | 15 | 99% | 100% | 99% | High |
- 1Disadvantaged Communities (DACs).
- 2Heavy-Duty Vehicle Inspection Program (HDVIP).
- 3Solid Waste Collecting vehicles (SWC).
- 42022 shore power fleet data is reported to CARB in March of 2023, and not available until 2024. Compliance number reflects 2021 statewide compliance for all fleets.
- 5Vehicles that meet Federal standards, but fall short of California's more stringent requirements are referred to as 49-state vehicles.
- 6Haloalkanes used in refrigerants.