
Current California GHG Emissions Inventory Data
The annual Assembly Bill 32 Greenhouse Gas Emissions Inventory (Inventory) presents California's GHG emissions by sector, year, and gas, as well as aggregate totals and trends. The 2026 edition Inventory includes emissions estimates for 2000 through 2024. CARB publishes an annual "Trends Report" that presents emissions data in a graphical format and describes trends in emissions and other indicators. Tabular emissions data are also available for download.
The latest edition of the Inventory uses global warming potentials (GWPs) from the Intergovernmental Panel on Climate Change (IPCC) Fourth Assessment Report (AR4). GHG Inventory Methods provides the data sources and calculation methods used to estimate California’s GHG emissions.
2024 GHG Emissions by Main Economic Sector
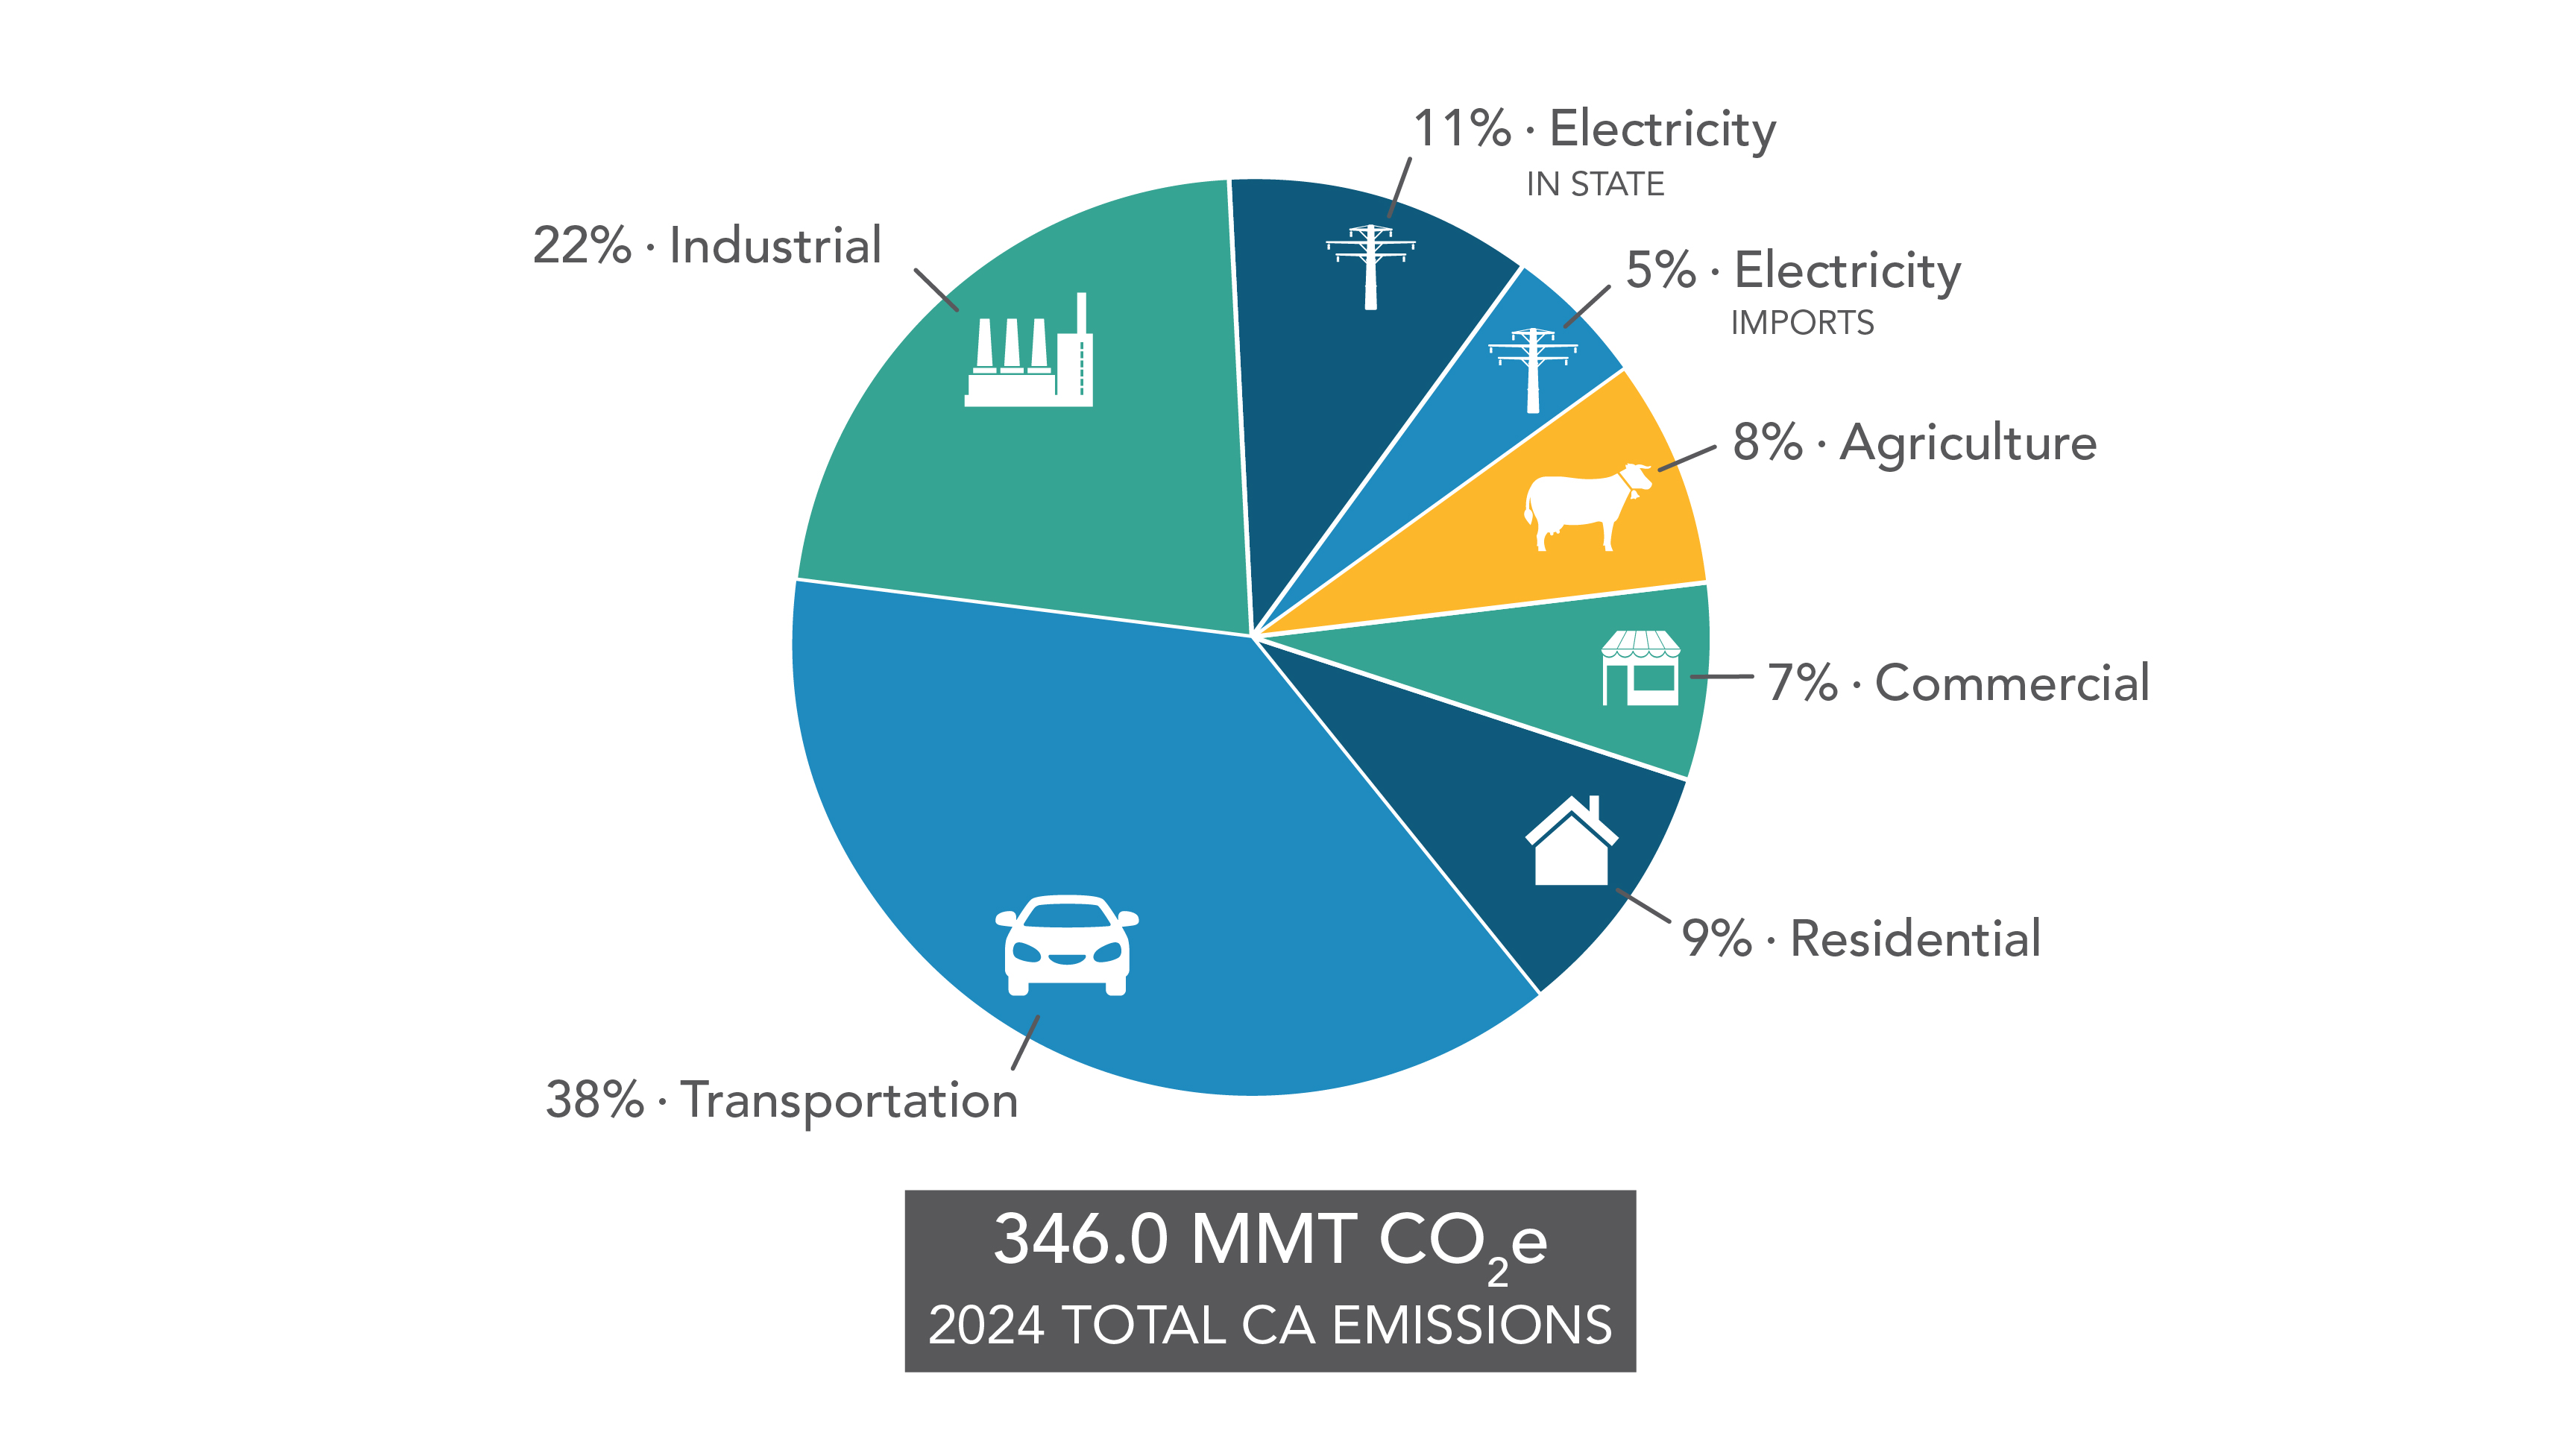
Graphic: California's greenhouse gas emissions in 2024 broken out by economic sector
Trends Report
The annual Trends Report summarizes and highlights major annual changes and notable longer-term trends in GHG emissions and other indicators. It provides easy-to-read graphs and explanations to illuminate California's progress toward its commitment to reduce GHG emissions. The Trends Report figures and the data used to produce them are also available for download. A separate GHG Inventory Graphs webpage provides some key figures from the Trends Report.
2000–2024 GHG Emissions Trends Report Figures and Data [xlsx]
GHG Inventory Data
Tabular emissions data is available for download in the grid below in three file types and categorization schemes. See the Inventory Categorization Crosswalk [xlsx] for a crosswalk among the three Inventory categorization schemes:
- The Scoping Plan categorization organizes emissions by CARB program structure, following the categories identified in the AB 32 Scoping Plan.
- The economic sector categorization generally aligns with how sectors are defined in the North American Industry Classification System. This categorization allows for comparison with other CARB emission inventories, which are similarly categorized.
- The IPCC categorization groups emissions into four broad categories of emission processes. This format conforms to international GHG inventory practice and is consistent with the national GHG inventory that U.S. EPA has historically submitted annually to the United Nations.
The file types available are:
- The "Full Inventory" sheets provide the greatest level of detail: emissions by gas and by year for each sector, subsector, and activity.
- The "GHG Emissions Summaries" present these same emissions aggregated into sectors.
- The "CH4 Only Summaries" sheets provide methane emissions by sector for each categorization scheme.
Full Inventory | GHG Emissions Summaries | CH4 Only Summaries |
|---|---|---|
The "GHG Emissions Summary by Gas" provides a summary by gas.
GHG Emissions Summary by Gas [xlsx]
Most of California's GHG emissions result from fuel combustion. The file below contains the amount of each fuel and associated heat input used by each sector. This workbook uses the economic sector categorization.
Fuel Combustion and Heat Input [xlsx]
The individual activity and parameter values used to calculate the GHG emissions presented in the Inventory can be found in the application below.
GHG Inventory Documentation Index (Coming Soon)
Guidance & Resources for Working with GHG Inventory Data
Recalculations
Each new edition of the Inventory includes recalculations to reflect changes in statistical data supplied by other agencies and to incorporate new methods. Emissions are recalculated for all years to maintain a consistent time-series per IPCC guidance. Thus, each edition of the Inventory may present different emission levels for historical years than previous editions. All previously published editions of the Inventory are available in the Data Archive.
Cogeneration Emissions
CARB’s Regulation for the Mandatory Reporting of GHG Emissions (MRR) categorizes emissions differently than the Inventory. Industrial cogeneration (also known as combined heat and power) represents a major categorization difference. The guidance document below provides instructions that can be used while working with and comparing the two datasets.
The spreadsheet below provides Inventory industrial cogeneration emissions disaggregated one level beyond the sector and activity levels provided in the Inventory by Economic Sector. The additional source level facilitates comparison with MRR data.
2012–2024 Industrial Cogeneration Breakout [xlsx]