GHG 2020 Business-as-Usual Emissions Projection
Contact
2014 Edition BAU Emissions Projection
An emission projection estimates future emissions based on current emissions, expected regulatory implementation, and other technological, social, economic, and behavioral patterns. The projected 2020 emissions provided here represent a Business-as-Usual (BAU) scenario assuming none of the Scoping Plan measures are implemented. The 2020 BAU emissions estimate assists the Air Resources Board (ARB) in demonstrating progress toward meeting the 2020 goal of 431 MMTCO2e (the revised target using Global Warming Potentials (GWP) from the IPCC Forth Assessment Report (AR4)).
The 2020 BAU emissions projection has been revisited in support of the First Update to the Scoping Plan (2014). This projection accounts for updates to the economic forecasts of fuel and energy demand as well as other factors. It also accounts for the effects of the recent economic recession and the projected recovery. Data sources, methods and assumptions are available in the links section below. CARB prepared the first version of 2020 GHG emissions projection in 2008 for the original AB32 Scoping Plan and a second version in 2010 to support Cap & Trade. Previous versions of the 2020 projection are archived and provided below.
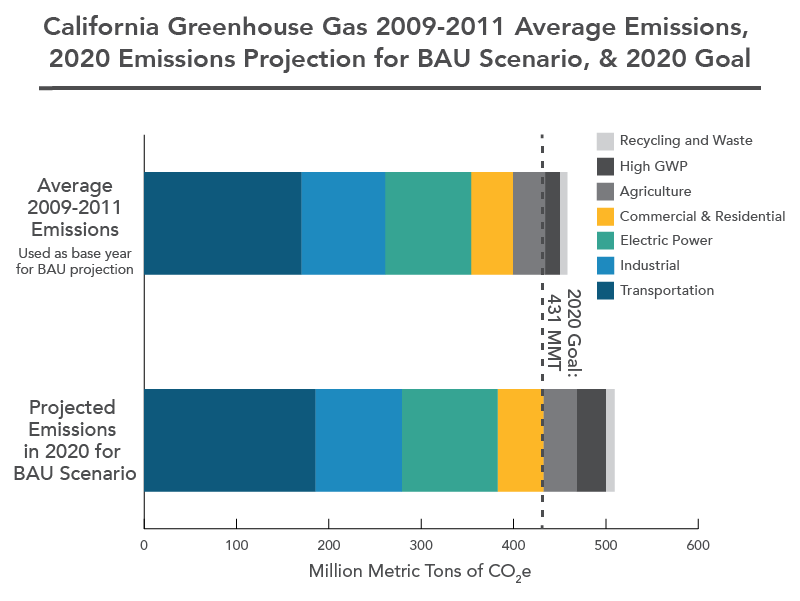
The 2020 BAU emissions projection uses the average statewide GHG emissions for 2009-2011 as the base year. Using a three year average dampens variations that may make a given year unsuitable as the basis for projection analysis. For example, using a hot and dry year, with higher power consumption and less hydroelectric power generation as the base year would skew the projected emissions associated with power generation. The current 2020 BAU emissions projection uses GWP values from IPCC AR4, while the previous versions used IPCC Second Assessment Report (SAR) GWPs. The total emissions expected in the 2020 BAU scenario includes reductions anticipated from Pavley I and the Renewable Electricity Standard (30 MMTCO2e total). With these reductions in the baseline, estimated 2020 statewide BAU emissions are 509 MMTCO2e.
2020 BAU Emissions
The bar graph below shows the 2020 BAU emissions relative to the base year average of 2009-2011 by sector. Half the BAU growth in 2020 comes from the Transportation and Electric Power sectors, while another third comes from the High GWP sector alone. Energy use (as seen in the transportation and electricity use emissions) is a driving force leading to emissions increases in the future. Fortunately, these emissions are regulated under Cap & Trade so actual 2020 emissions will be lower than the BAU scenario.
Below the chart are links to materials and methods related to the 2020 BAU emissions projection. These include a summary of 2020 BAU emissions by sector, emissions reduction contribution from each complementary measure, documentation of data sources and methods, time series of projected BAU emissions, and links to previous projections created in support of the AB 32 Scoping Plan (2008) and the Cap & Trade Regulation (2010).

Additional Resources
2020 BAU Emissions by Scoping Plan Categories
Data Sources, Methods, & Assumptions
Emissions Reductions from Scoping Plan Measures
2020 BAU Projection Time Series 2009-2020
Archived 2020 Business-as-Usual Emissions Projection
Overview of Archived Projections
The two previous California 2020 Business-as-Usual (BAU) greenhouse gas (GHG) emissions projections used in the AB 32 Scoping Plan (2008) and for the Cap & Trade Regulation (2010) are archived below. These projections were used to assess the GHG reductions necessary to return California to 1990 emission level based on the GHG inventories published by ARB in support of its programs. California's current 2020 GHG emissions projection is available above.
The two previous 2020 BAU emissions projections are archived below.
| 2020 BAU Projection Version | Archive Document |
|---|---|
| Original Scoping Plan (2008) | Archive Documentation |
| Cap-and-Trade Update (2010) | Archive Documentation |
