Program Overview
The Off-Road Diesel Equipment Surveillance Program is an in-use emissions testing program designed to better characterize real-world emissions and operational performance of off-road diesel equipment. The data collected through this program support various CARB internal efforts, including emissions inventory development and policy design. The program is conducted at CARB’s Depot Park facility (8311 Galena Ave., Sacramento, CA 95828) using portable emissions measurement systems (PEMS).
Background and Objectives: Why This Program is Important
Off-road diesel equipment plays a critical role in California’s economy, supporting construction, emergency response, power generation, transportation, and public services. Many types of ORE operate in diverse real-world environments, including residential and business areas, as well as major transportation hubs, such as airports, rail stations, and seaports.
Portable diesel equipment, including power generators, is often operated in disadvantaged communities identified under California’s environmental justice frameworks (AB 617 and SB 535). These communities frequently experience disproportionate and cumulative air pollution burdens from multiple sources. Collecting real-world emissions data from these equipment types is essential to support CARB’s efforts to reduce emissions and address cumulative impacts.
Accurate estimation of the environmental impact of mobile emission sources is essential for effective air quality management and plays a key role in California’s clean air programs and policy development. Therefore, this program investigates real-world operational patterns and emissions characteristics of off-road equipment.
This program prioritizes diesel equipment because off-road diesel engines account for a significant share of statewide emissions, including diesel particulate matter (29%) and nitrogen oxides (11%). These pollutants contribute to the formation of PM2.5 and ozone, which are key air quality and public health concerns in California. The data obtained through this program helps improve CARB’s emissions inventory and to inform evaluations of emerging and zero-emission technologies.
Current Focus (2025~2026): Portable Diesel Power Generators
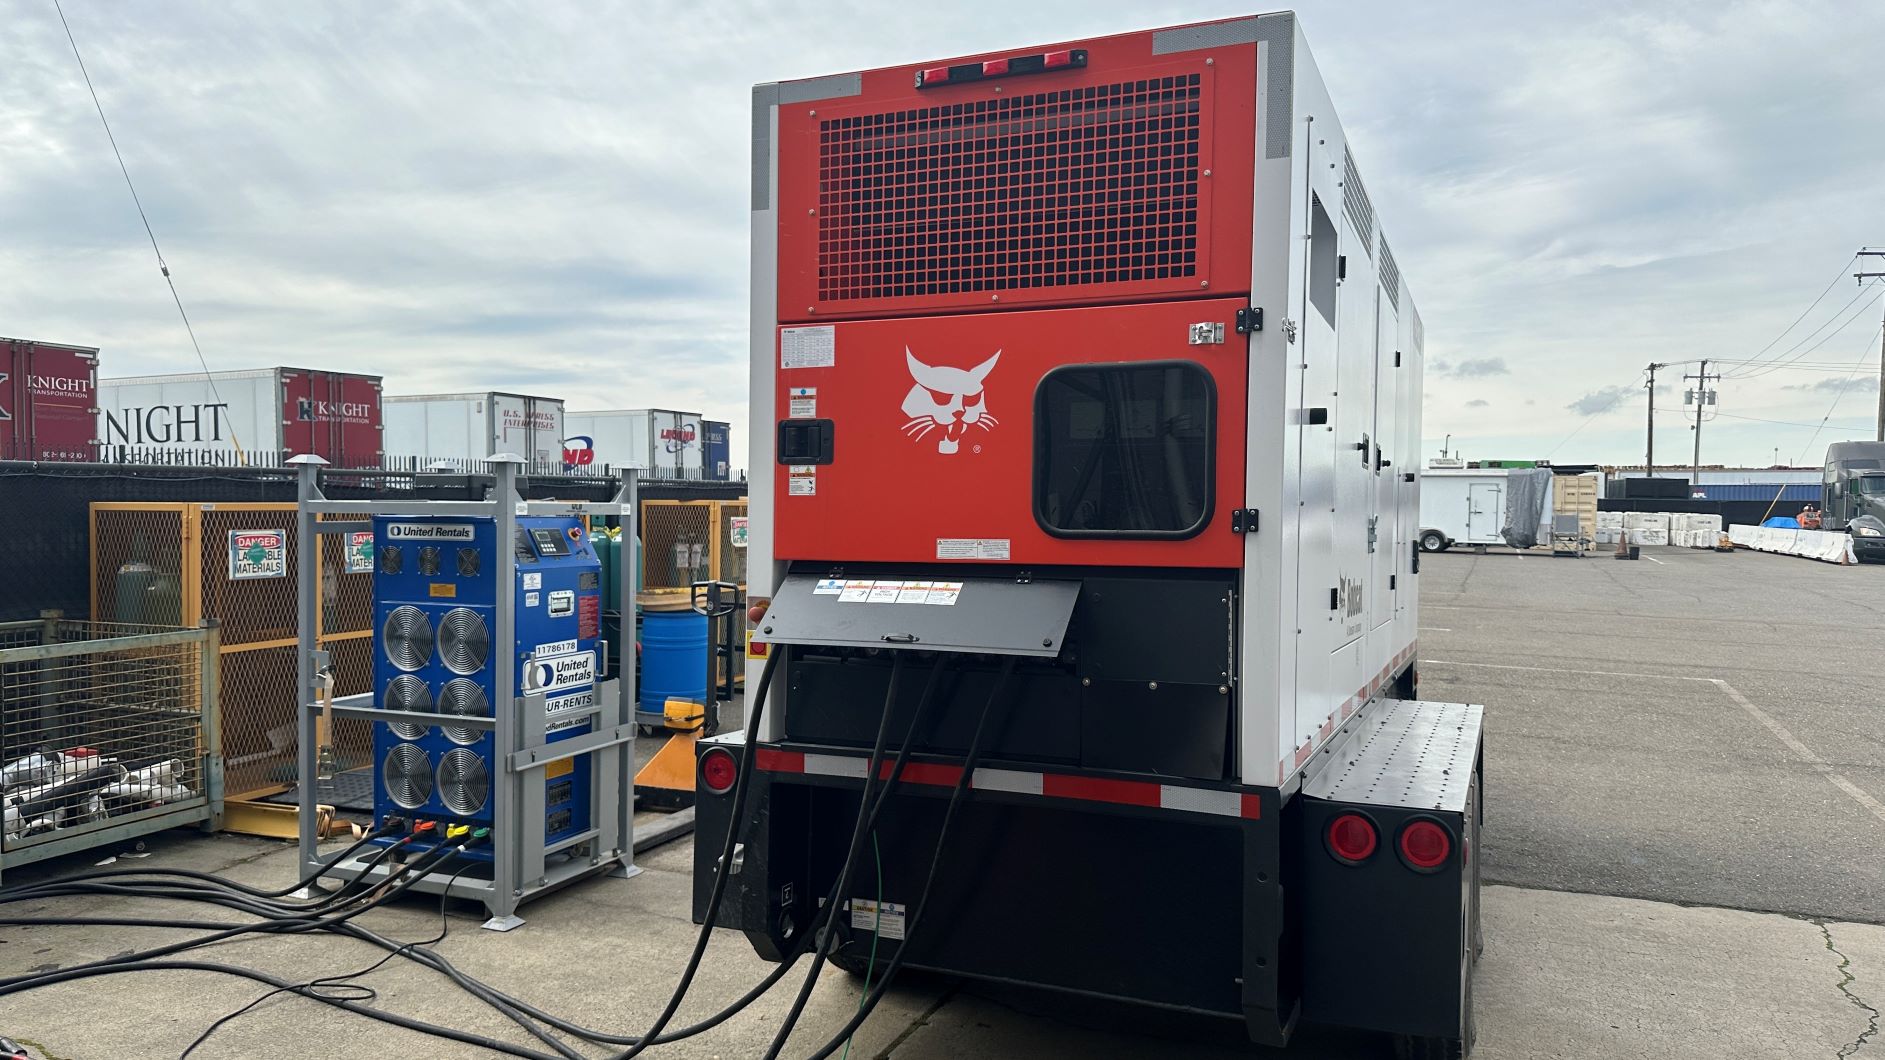
During the first two years of the program, CARB is prioritizing testing of portable diesel power generators (gensets). Common uses of gensets include emergency power supply, power for remote facilities, operation of appliances and tools, recreational activities, and backup power for critical operations.
Power generators support a wide range of businesses and events and can also be integrated with battery energy storage systems (BESS) to create hybrid or microgrid configurations. This category has shown significant market potential and growth over the past five years, partially due to the increasing demand for emergency power at artificial intelligence data centers.
Future Focus (202X): Mobile Off-Road Equipment
The ORE Surveillance Program is a continuous program and will expand its focus to mobile off-road equipment upon the completion of the generator testing phase. Potential test subjects include common, high-volume off-road equipment types, such as excavators, wheel loaders, and skid-steer loaders.
Procurement Requirements and Frequently Asked Questions
Exploratory Work and Emerging Technology Insights
Zero‑Emission Technology Evaluation
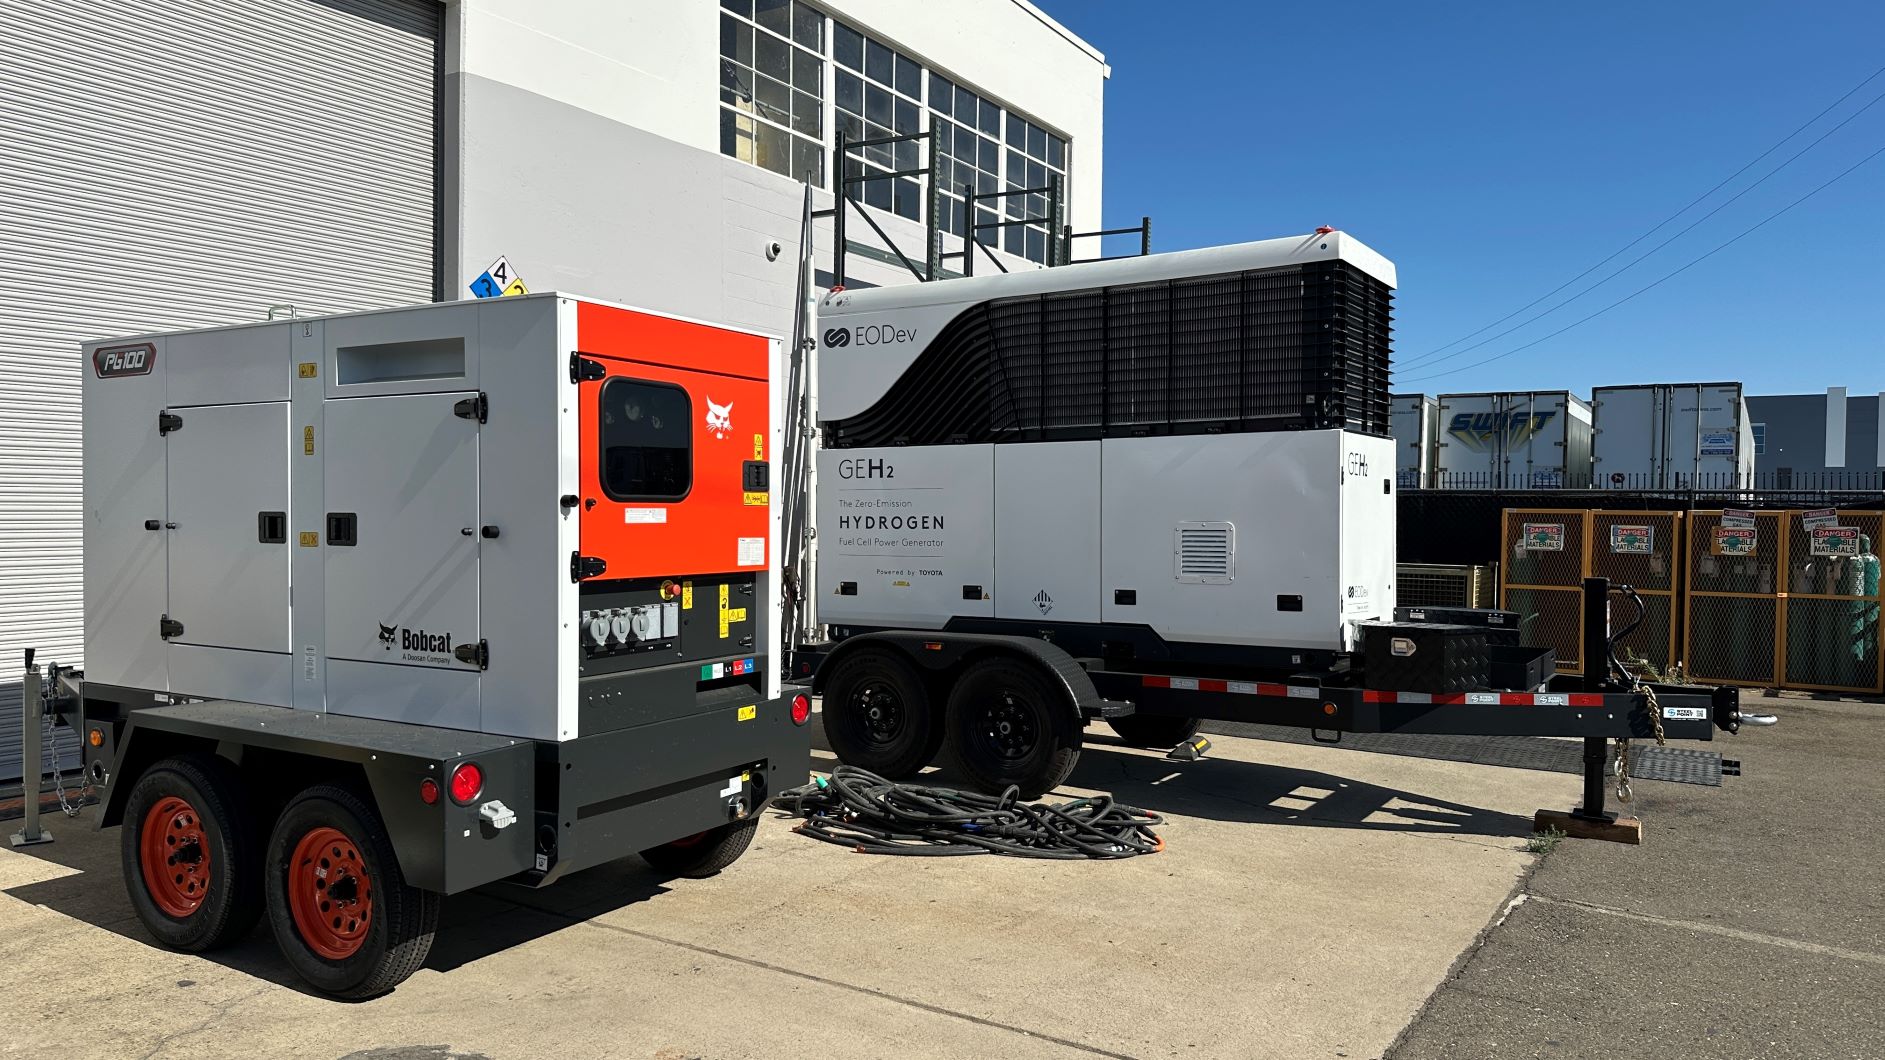
As part of CARB’s broader transition toward zero-emission technologies in off-road sectors, the ORE Surveillance Program also supports limited evaluations of zero-emission technologies when resources are available. In 2025, the program conducted a performance test of a hydrogen fuel cell (H2FC) power generator, which enabled a side-by-side comparison with a power-equivalent diesel generator.
Zero‑Emission Technology Knowledge Sharing and Demonstration Event
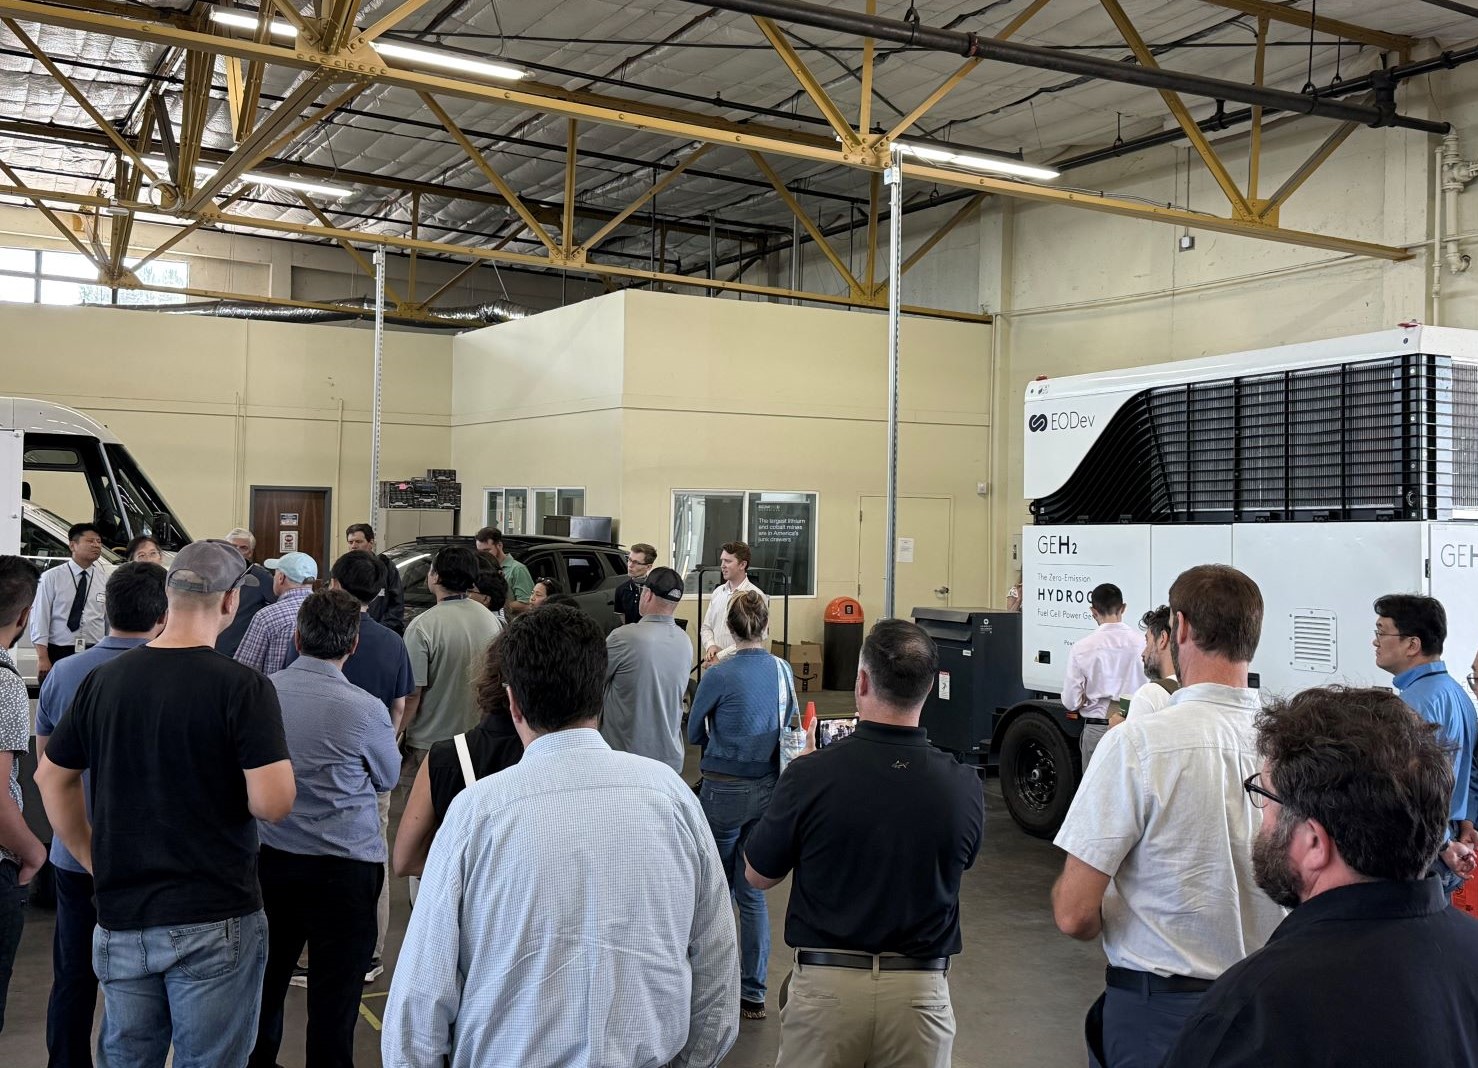
A knowledge-sharing and demonstration event was held on July 25, 2025, at Cal EPIC, with more than 70 attendees from CARB, ARCHES, non-profit organizations, research institutions, rental companies, and original equipment manufacturers (OEMs). The event included three technical presentations covering hydrogen production, fuel cell fundamentals, and H2FC generator systems. The OEM also demonstrated a live electric vehicle charging session.
Knowledge Sharing at Conference: Diesel Power Generator Emission Characteristics
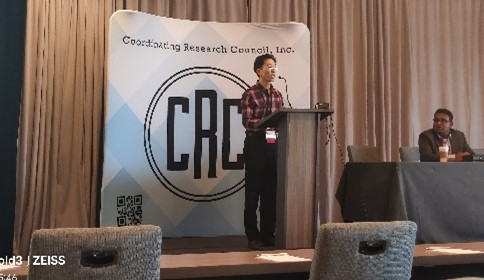
Emissions characteristics obtained from the surveillance program were presented at the 36th CRC Real World Emissions Workshop on March 10, 2026. The conference provides a strong platform for knowledge exchange among government agencies, industry, and academia on topics such as air quality policy, emissions data, alternative fuels, and zero-emission technologies. The presentation highlighted the program's value and implications for upcoming CARB initiatives.
Alignment with CARB Zero-Emission Programs
Enables early evaluation of emerging ZE technologies under in-use conditions.
Supports CARB zero-emission programs through real-world performance data.
Enhances cross-division coordination on ZE policy, research, and incentives.
Please ask any questions or request further discussions via junhyeong.park@arb.ca.gov.
Legislative Bill Tracking
Off
Division field is automatically filled by OIS on 06/21/2021
Off


