GHG Emission Inventory Graphs
The California greenhouse gas (GHG) Inventory compiles statewide anthropogenic GHG emissions. The graphs below provide a summary of emissions data for 2023 or for the time series of 2000-2023. All GHG inventory data is available on the current inventory page.
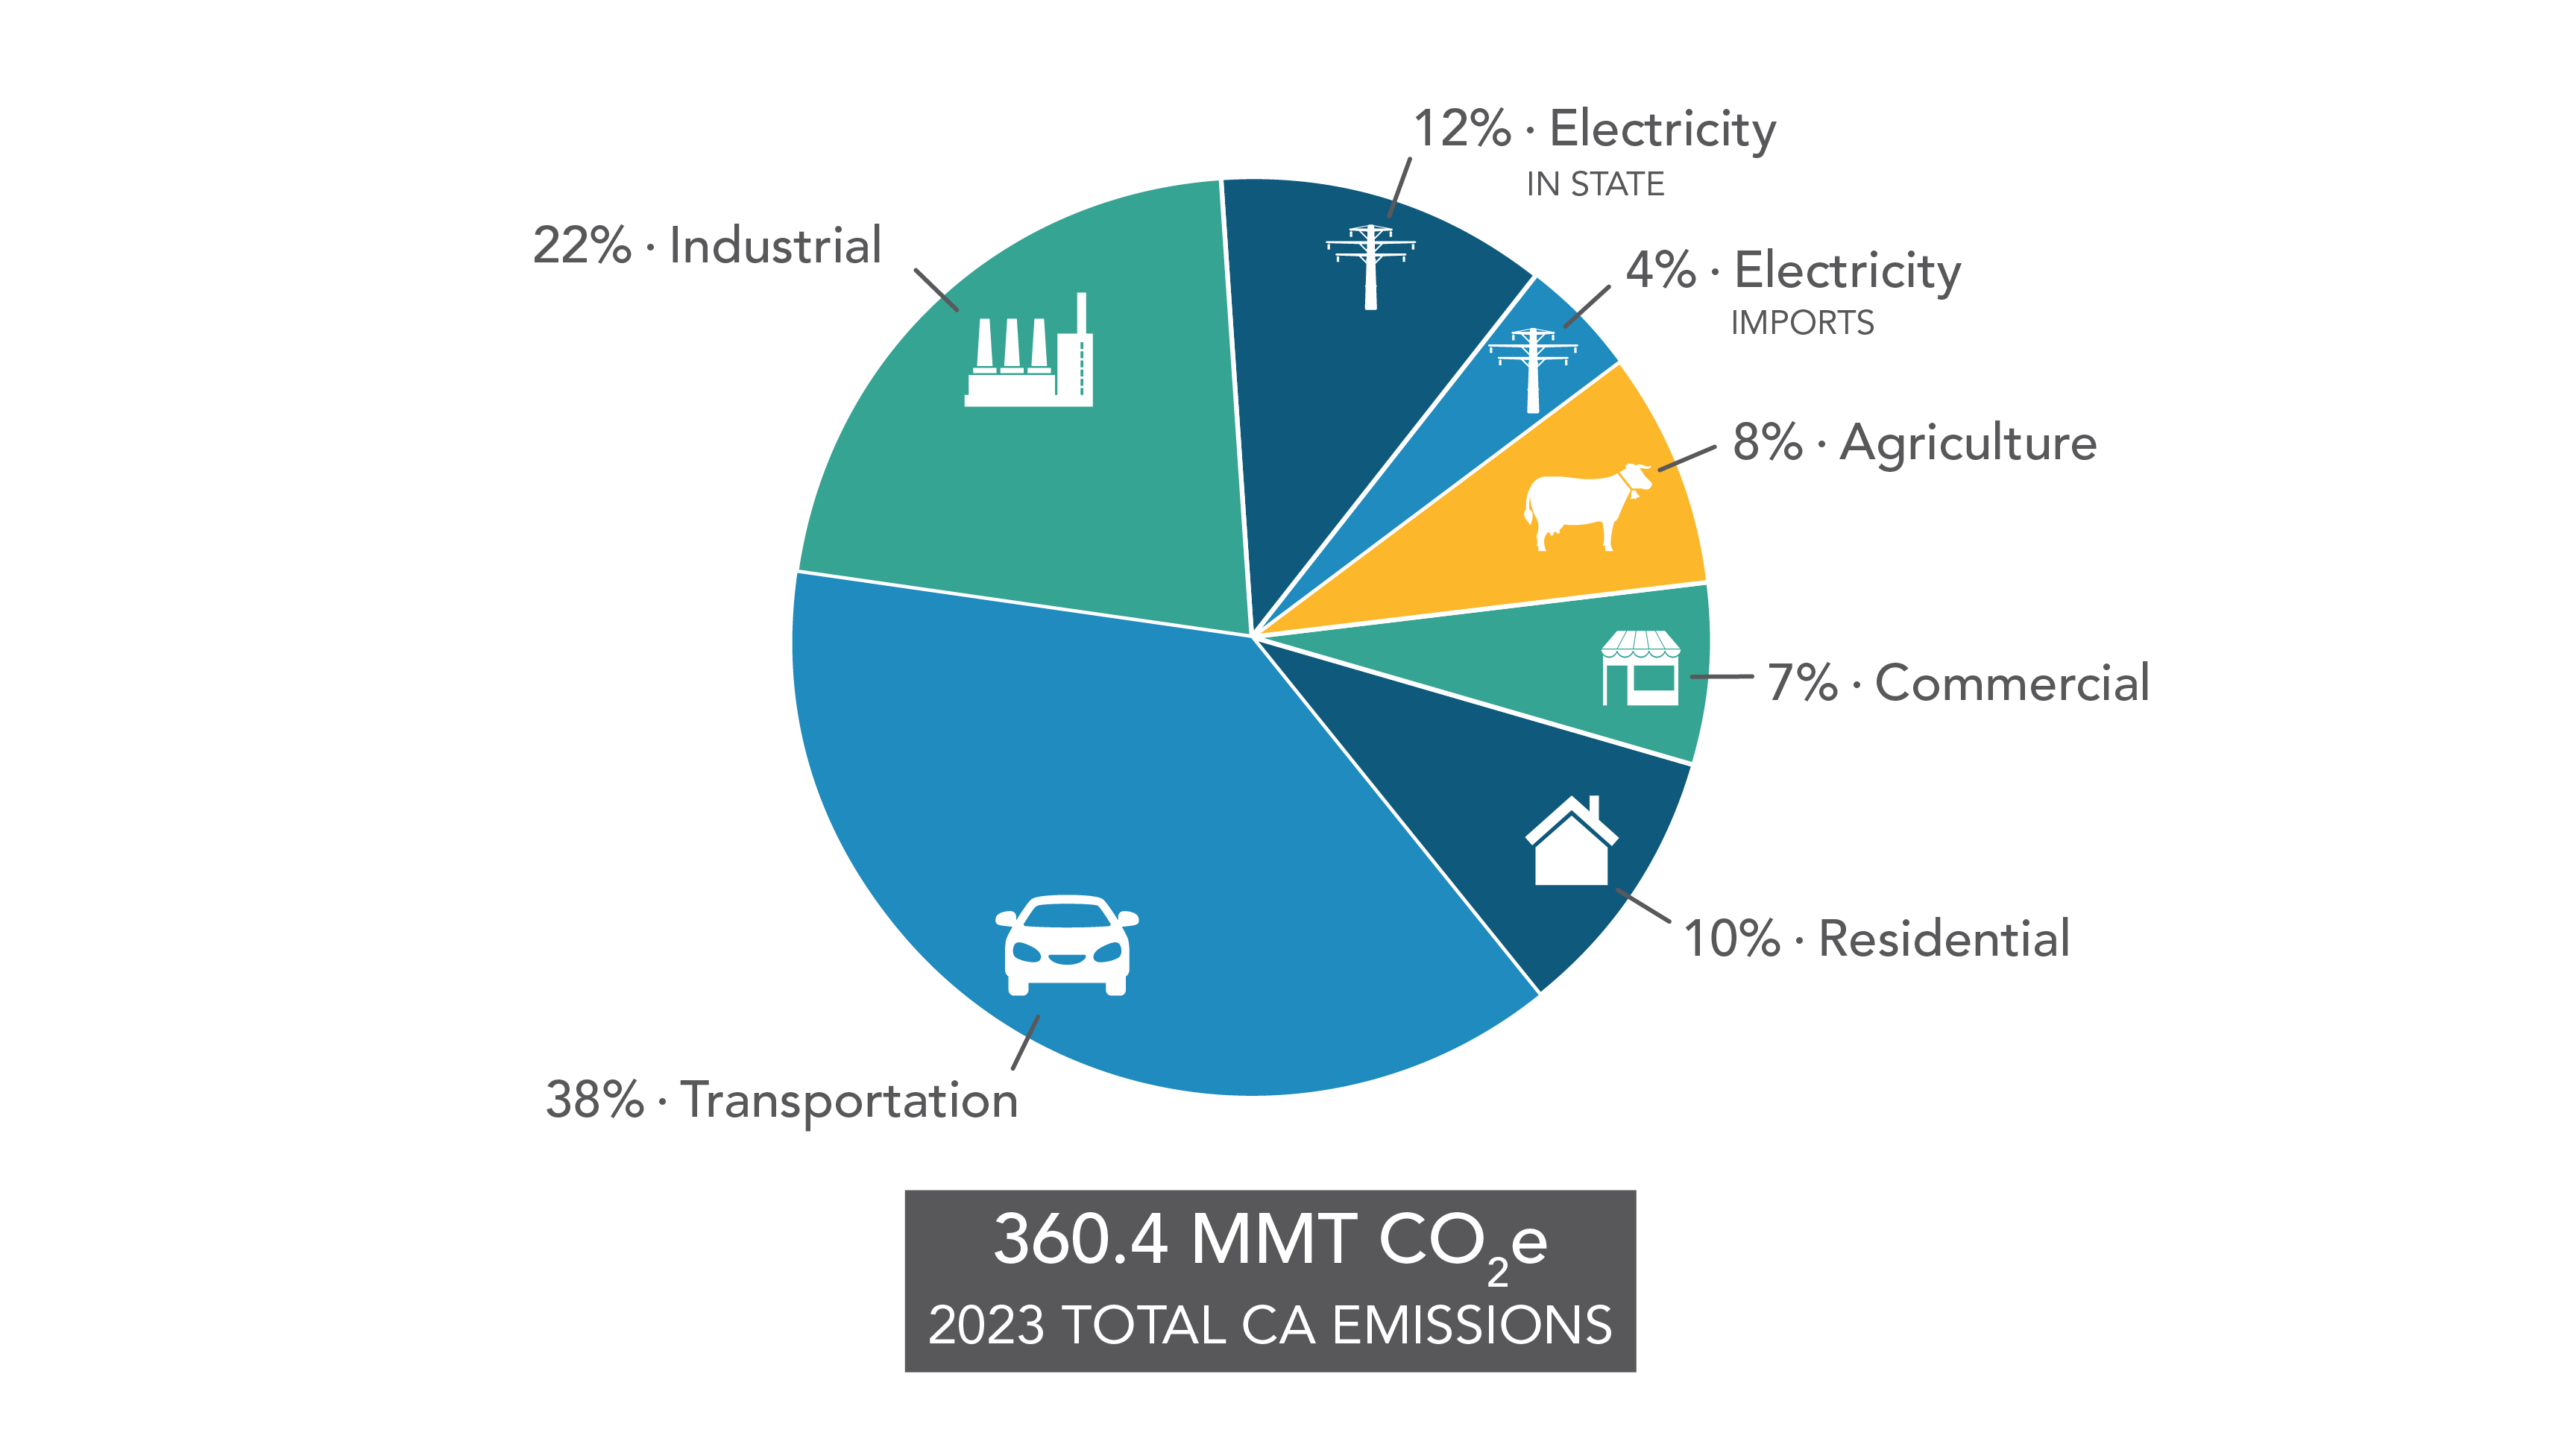
2023 GHG Emissions by Main Economic Sector
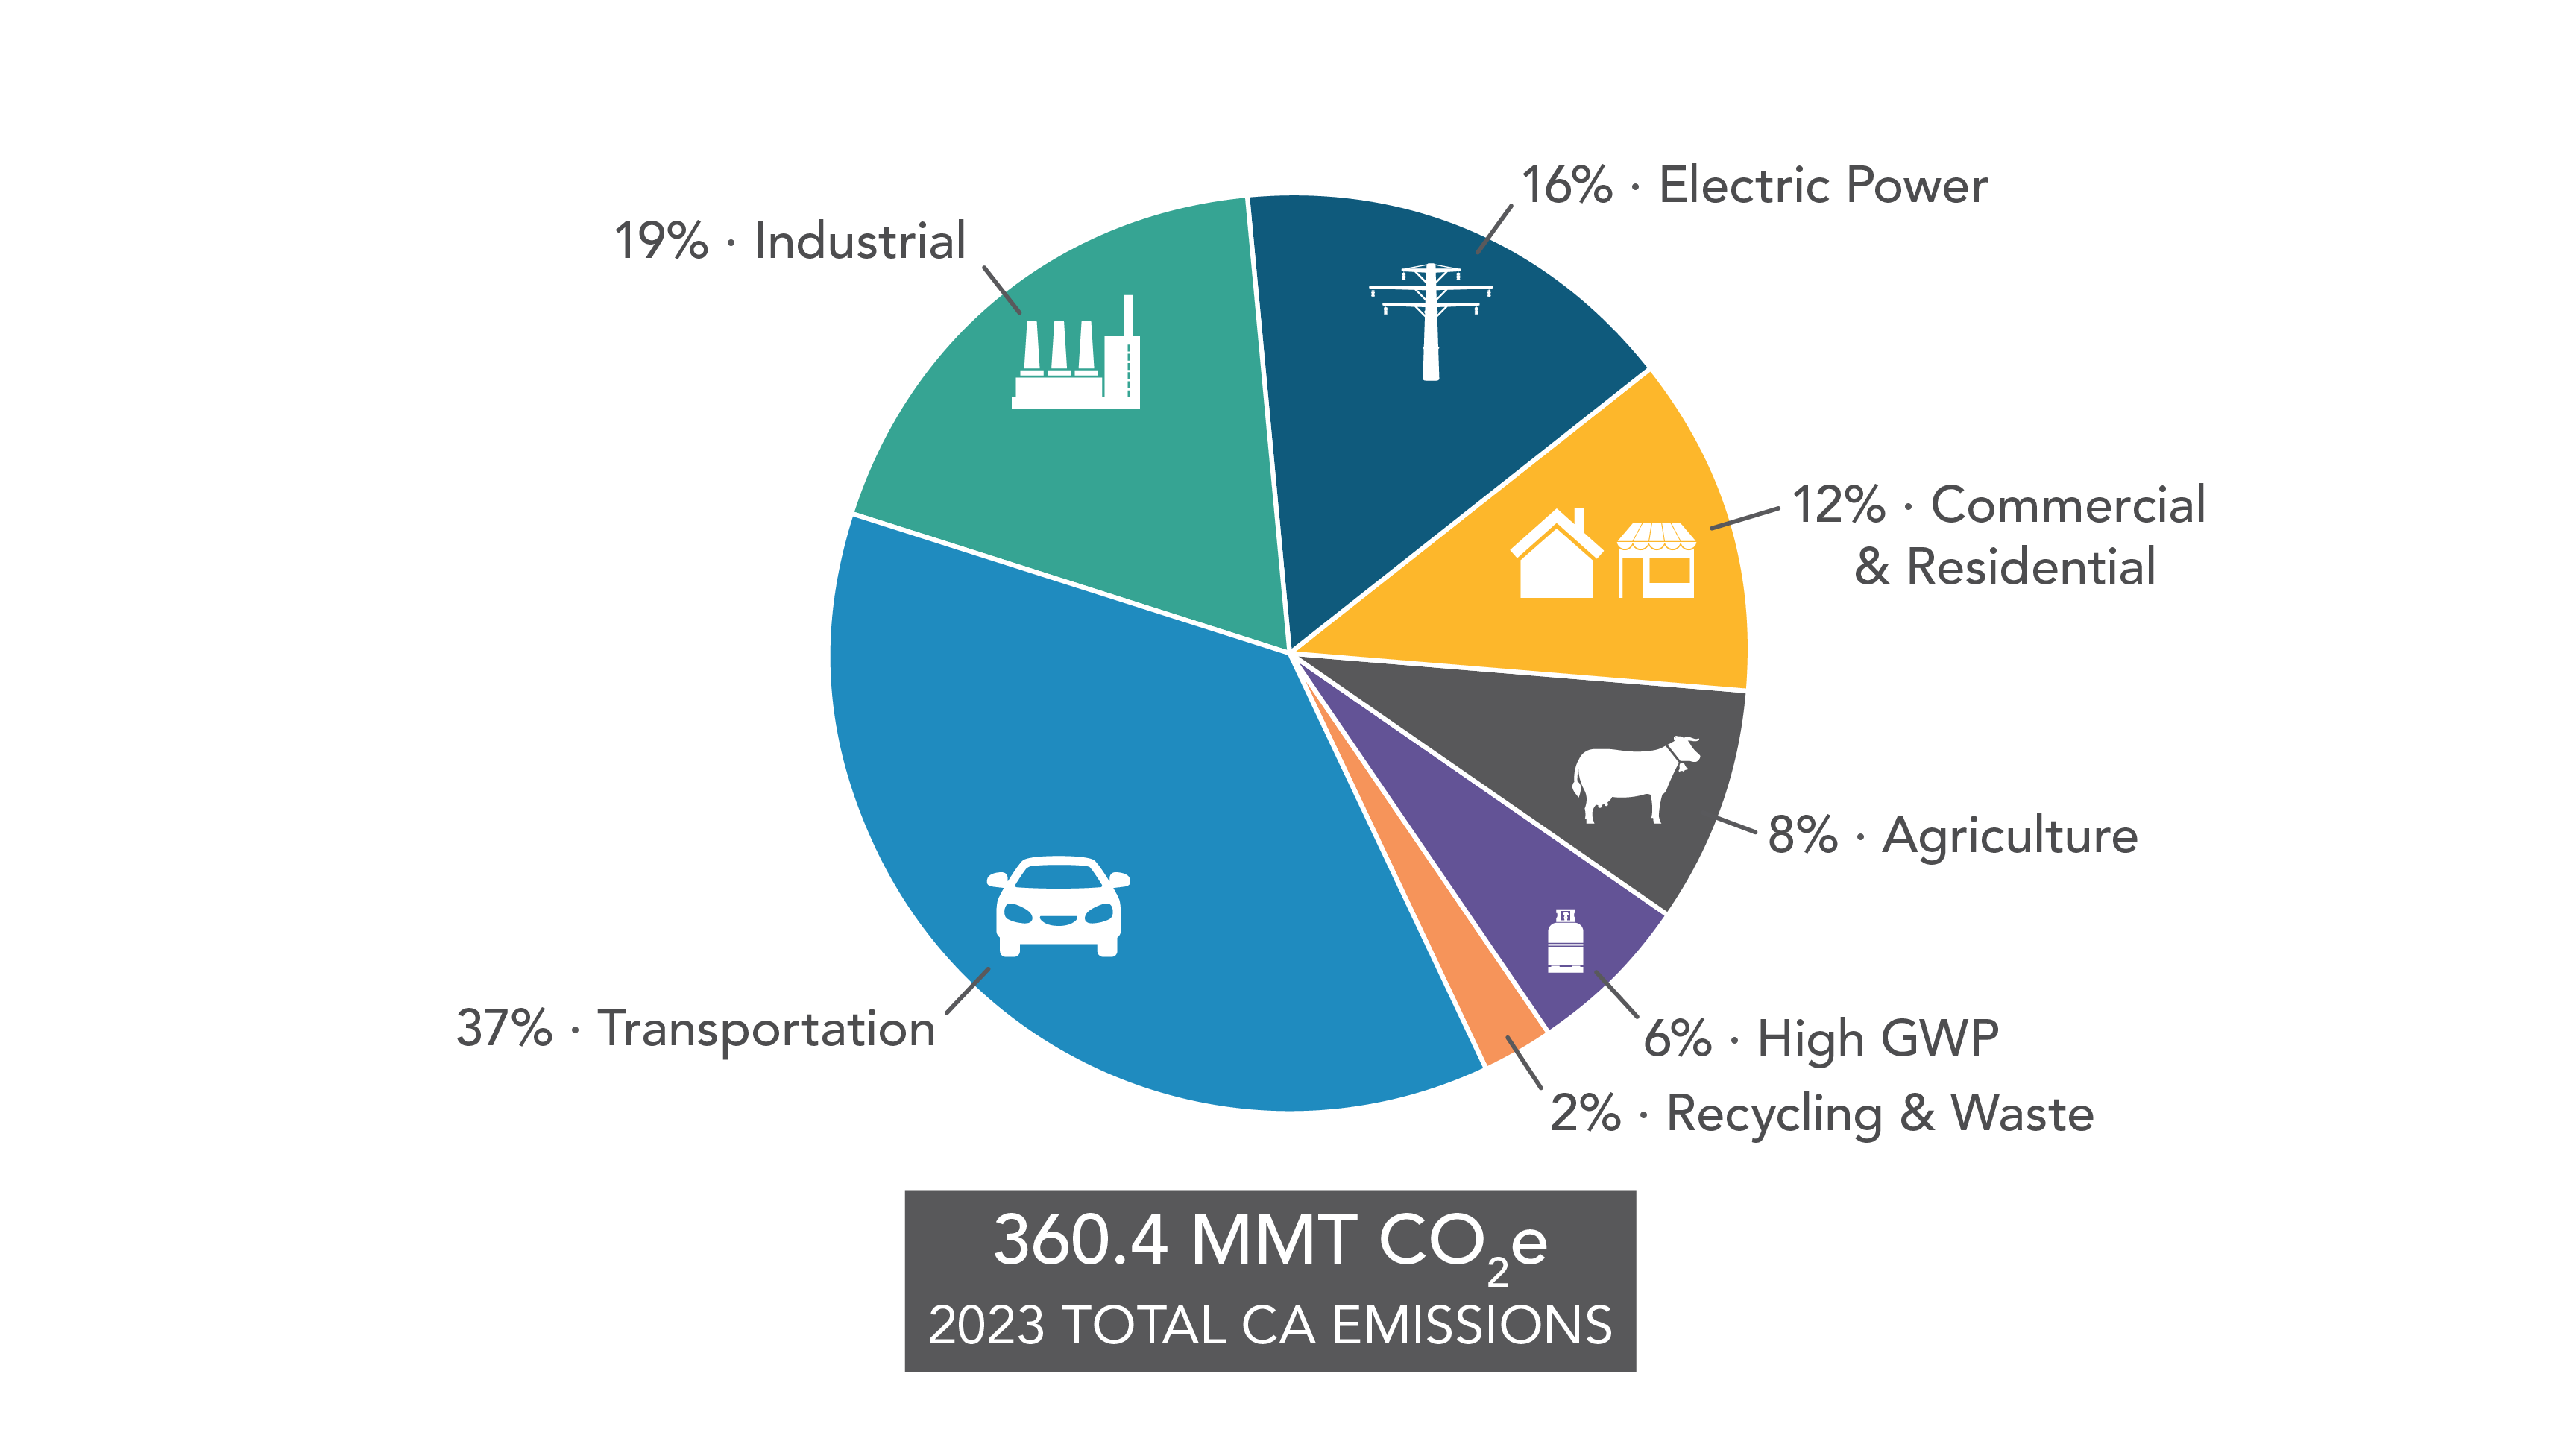
2023 GHG Emissions by Scoping Plan Category
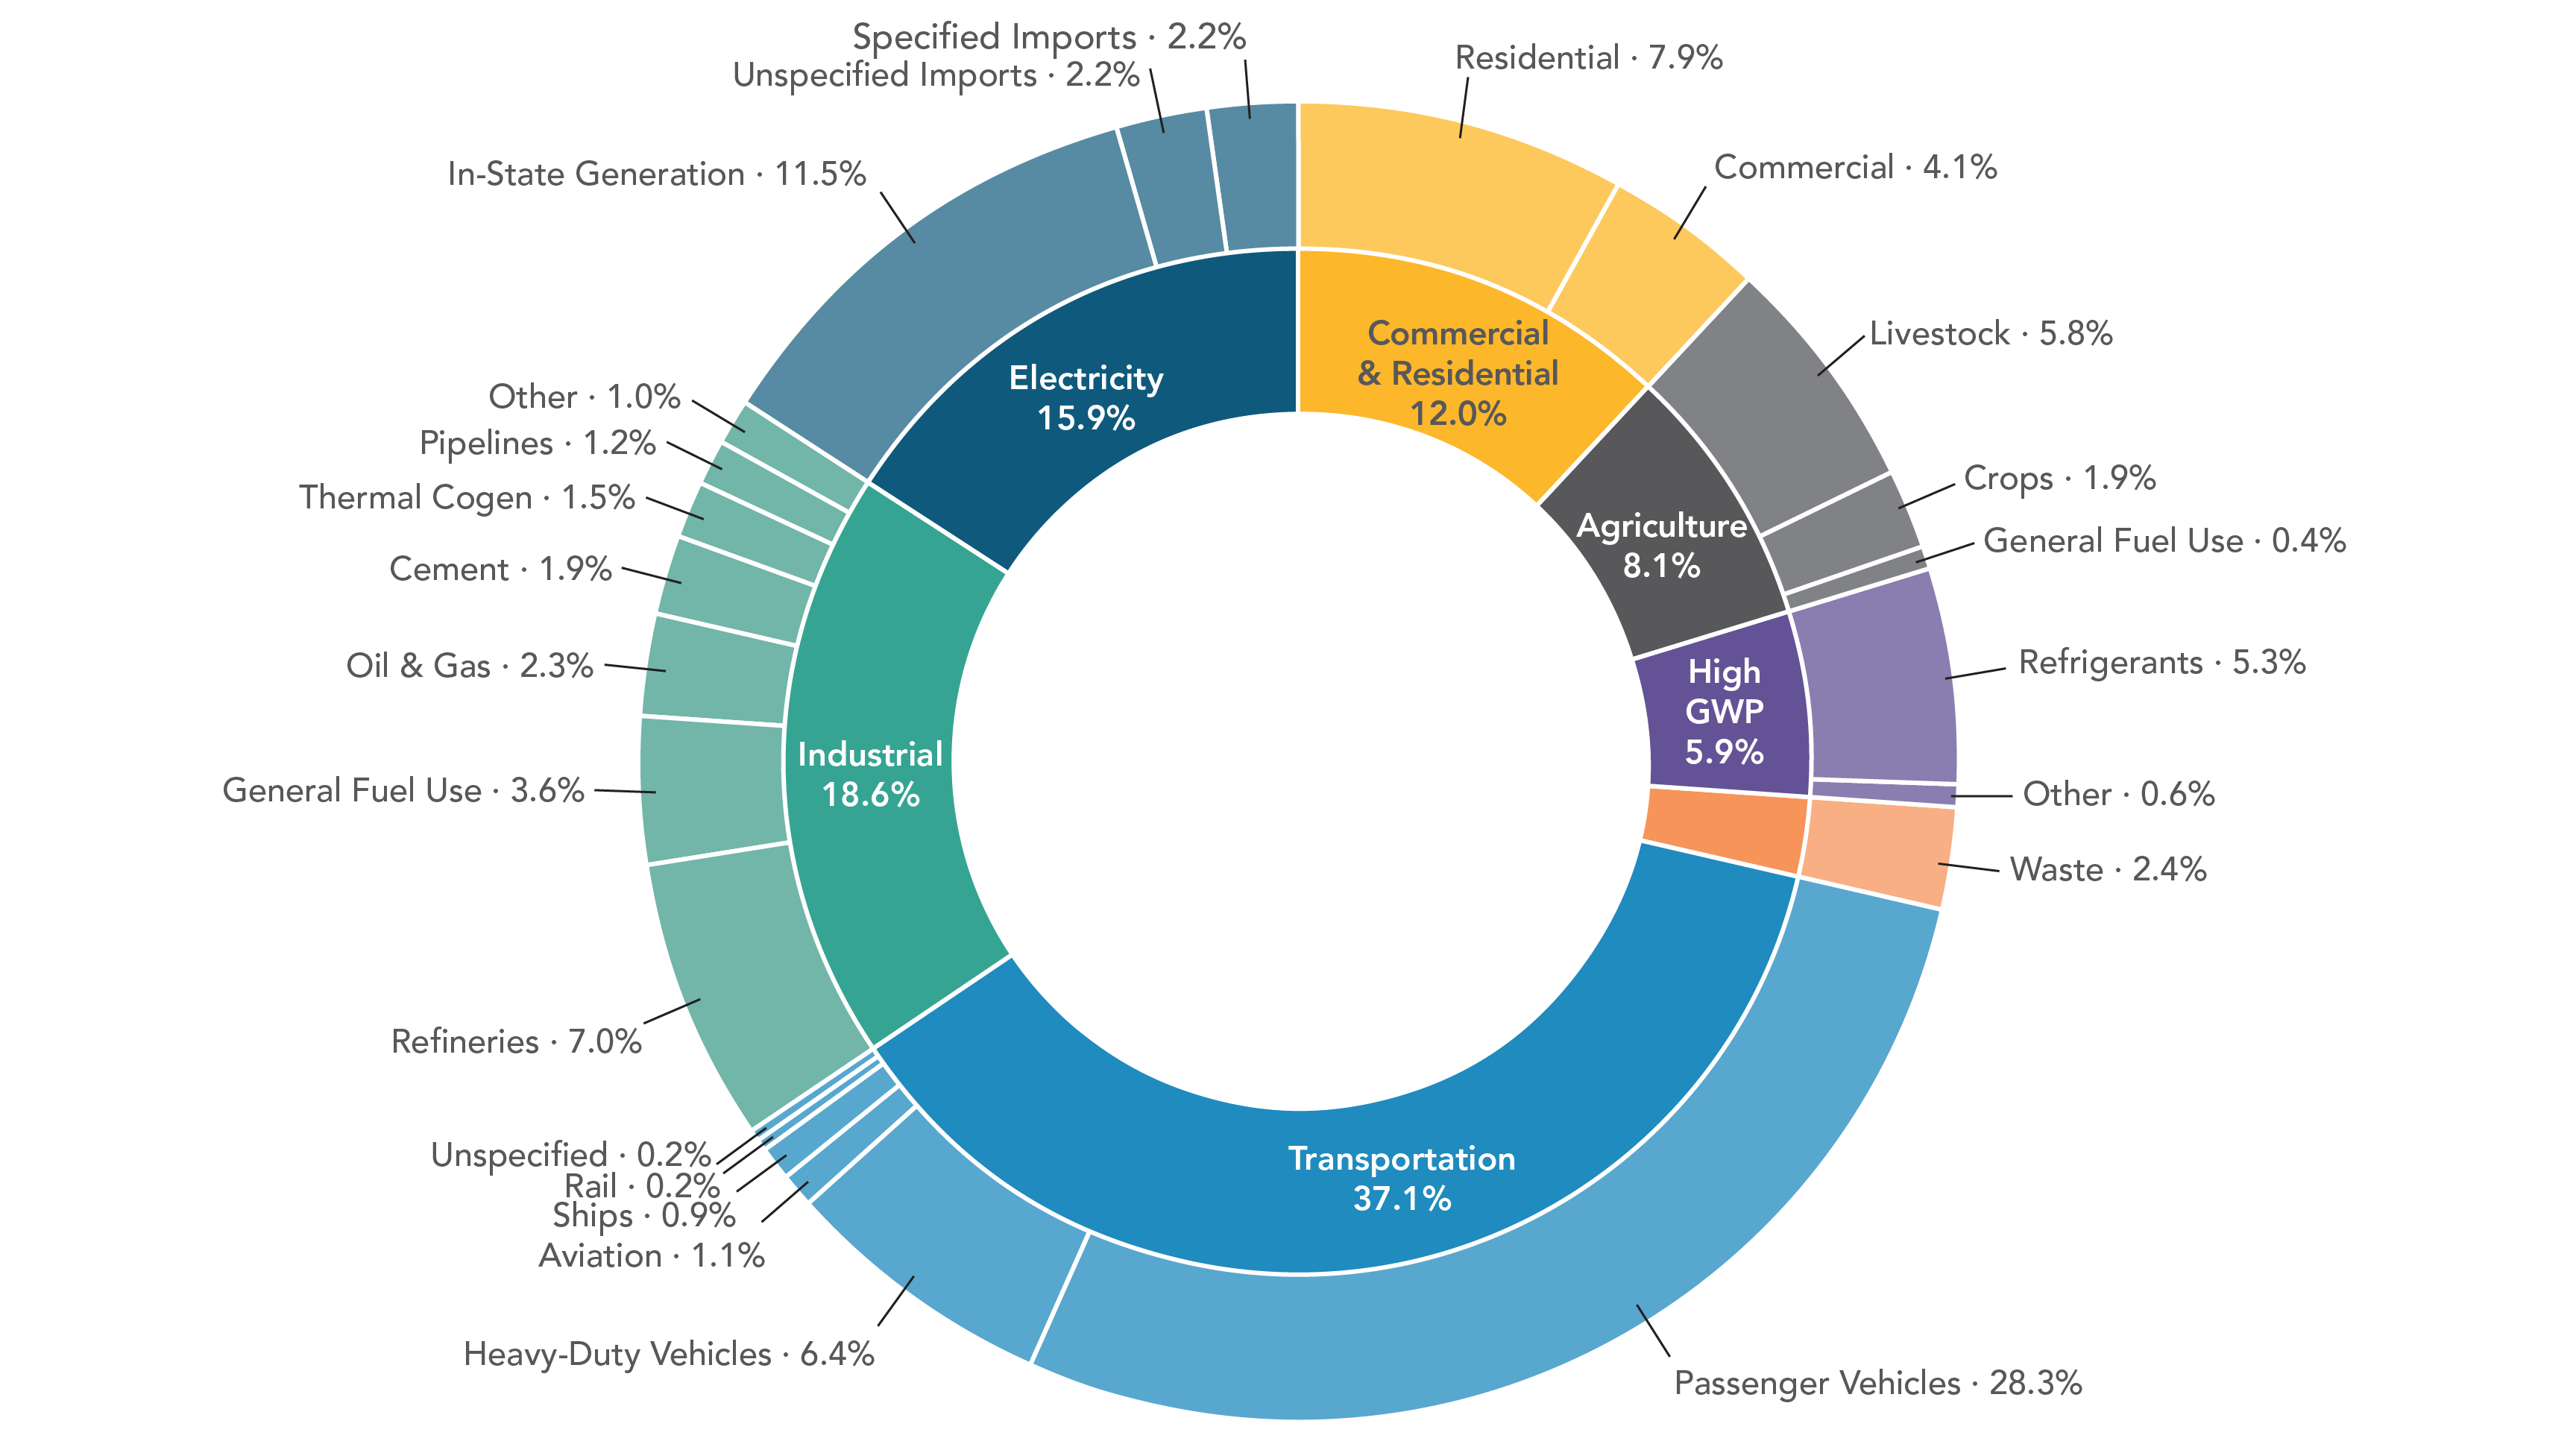
2023 GHG Emission by Scoping Plan Sub-Category
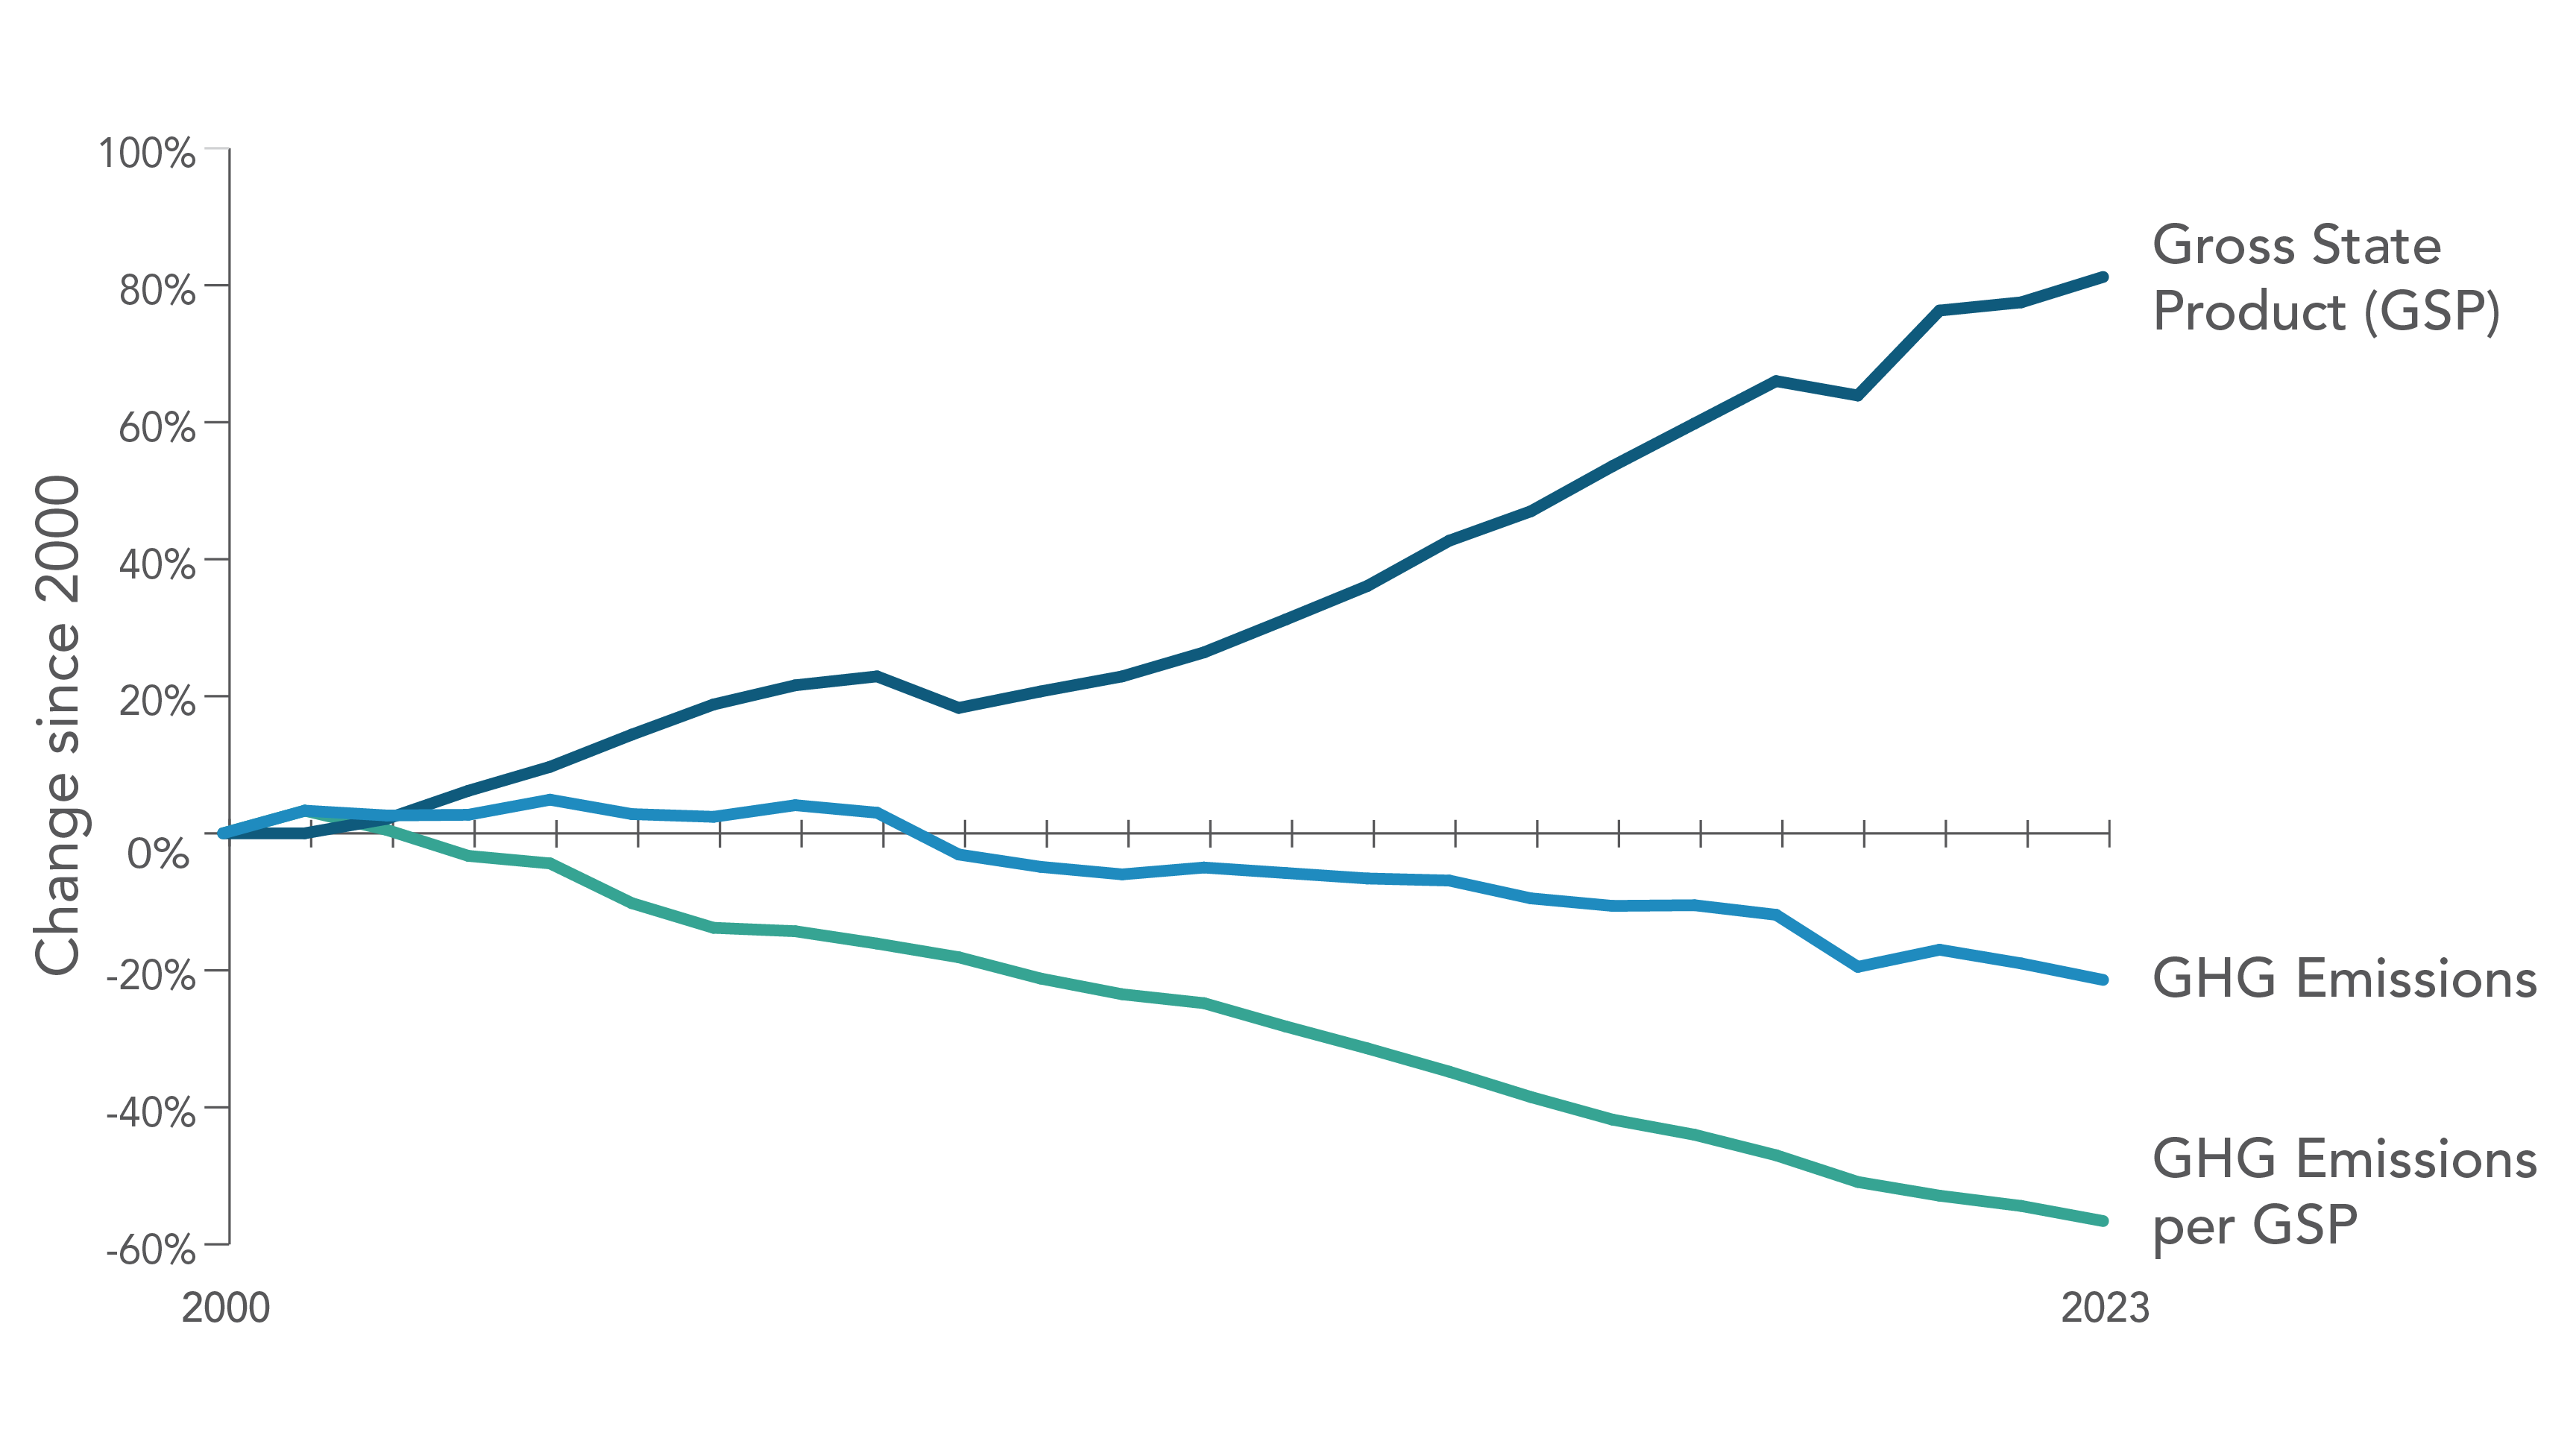
Change in California Gross State Product and GHG Emissions Since 2000
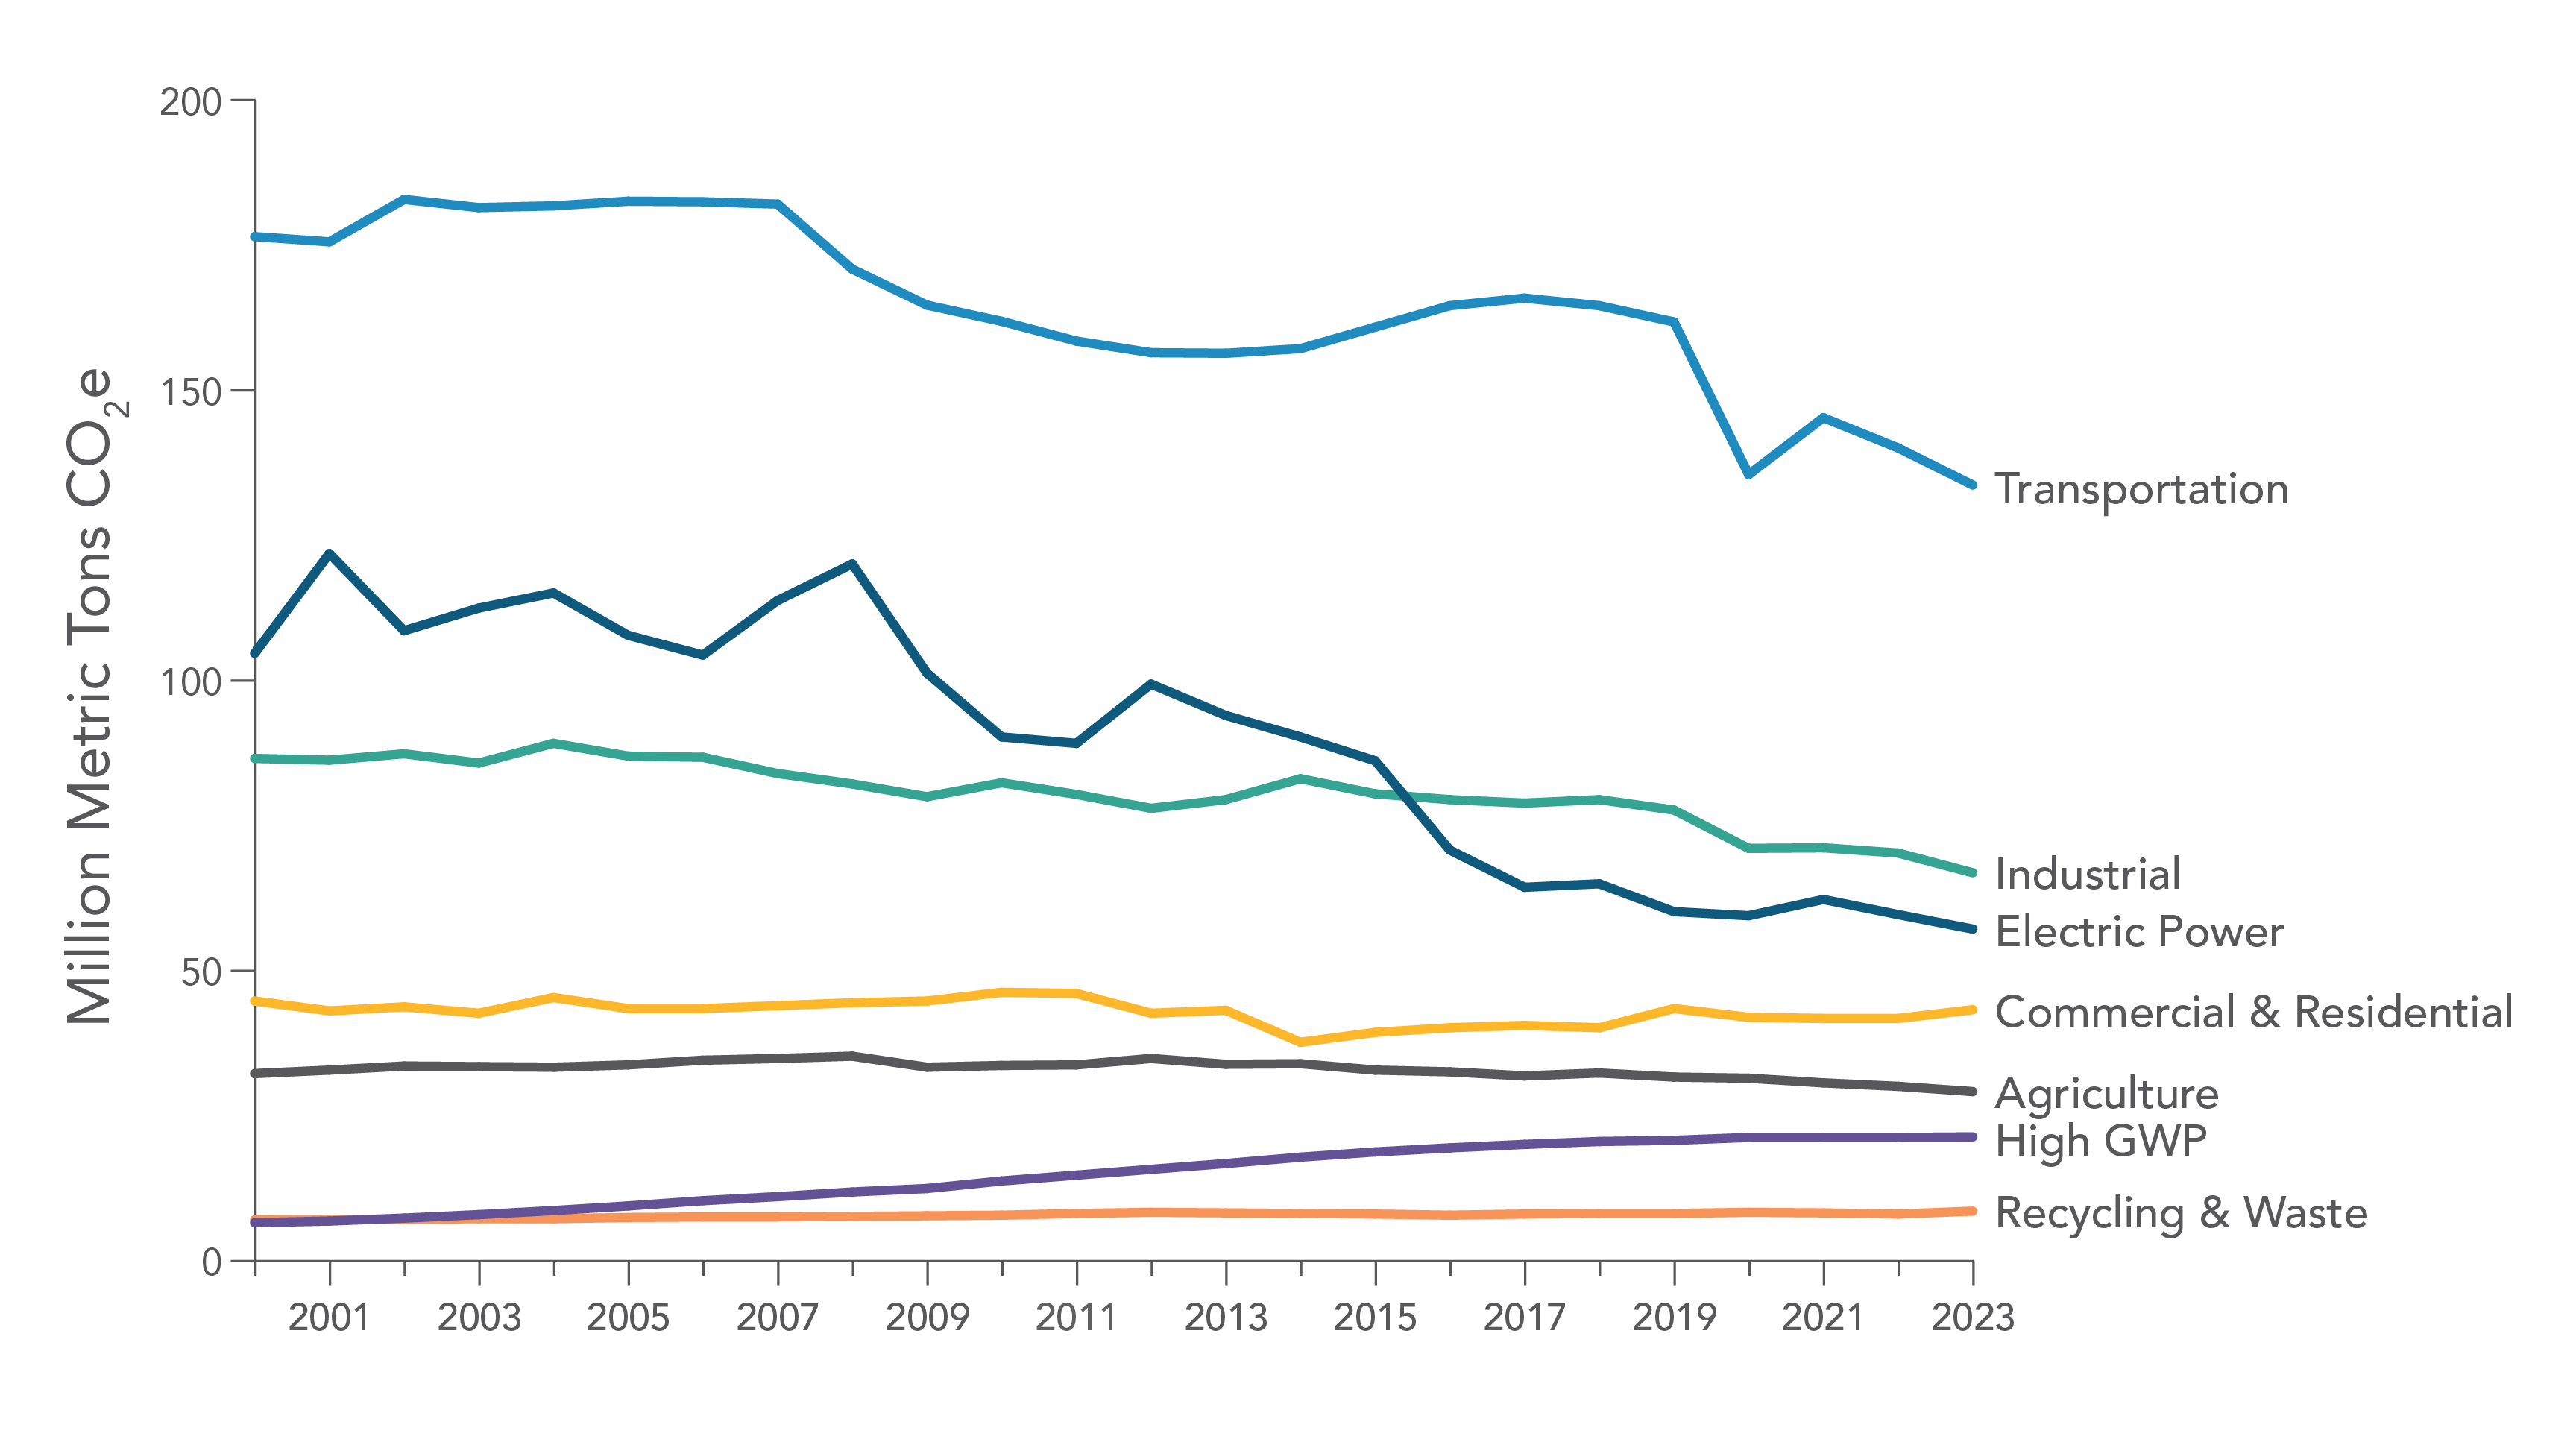
2000–2023 GHG Emissions by Category as Defined in the Scoping Plan