Harbor Communities Monitoring Study - Saturation Monitoring Project
Categories
Contact
This page updated March 09, 2015
What is Saturation Monitoring?
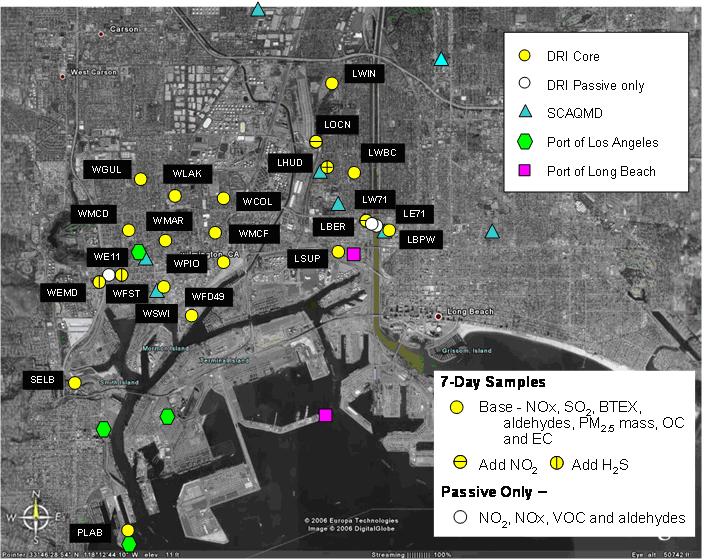
The Saturation Monitoring project used portable samplers to measure gaseous and particulate air pollutants in the Harbor Communities in a much denser monitoring network than is possible with traditional monitoring methods. The portable samplers consisted of passive samplers for measuring specific gases and mini-volume samplers for measuring particulate matter. Passive samplers are small collection tubes that absorb specific pollutants from the air and so require no pumps (or power source) to collect samples and to measure air pollutant concentrations. Mini-volume samplers are compact portable devices that have a small pump that is powered by a battery (independently or trickle charged with an AC power source). Thus, these portable devices, permit researchers to saturate the study area with monitors. A number of these passive samplers were placed throughout the Harbor Communities area, as shown in the map below.
What measurements were made?
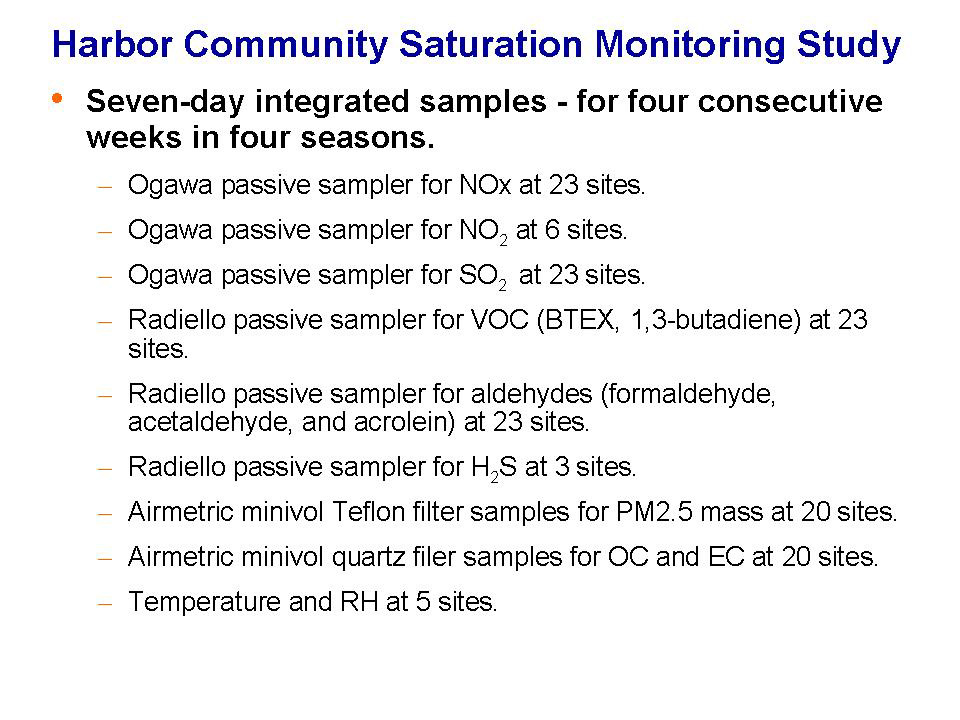
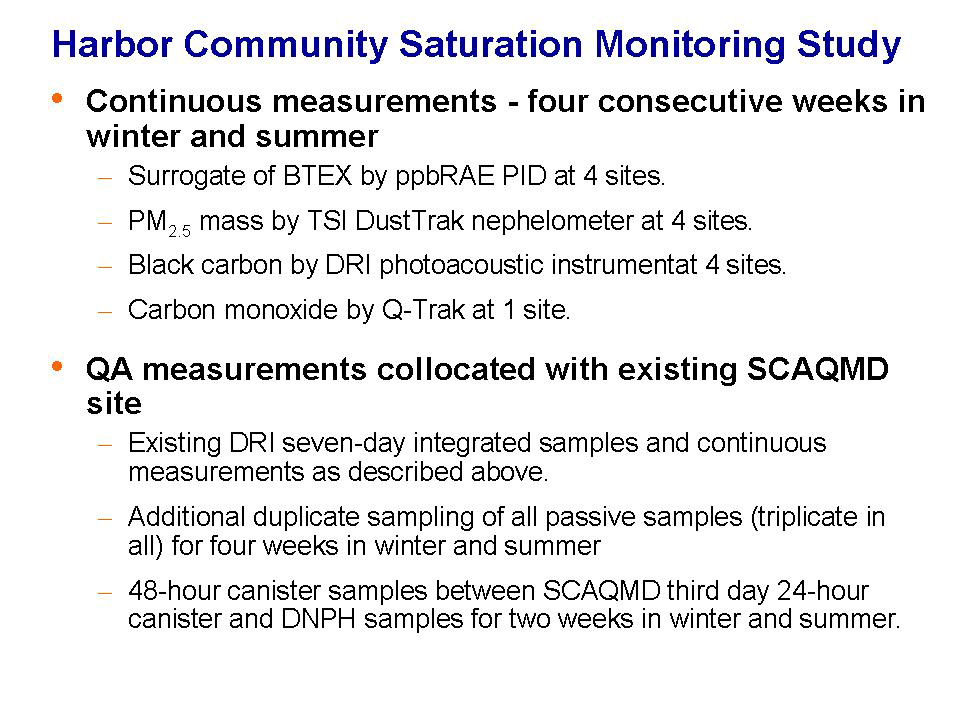
Saturation monitoring was conducted at 20 sampling locations. Pollutant concentrations measured included nitrogen oxides (NOx), nitrogen dioxide (NO2, at 3 sites), sulfur dioxide (SO2), hydrogen sulfide (H2S, at 3 sites), selected volatile organic compounds, PM2.5 mass, black carbon (BC), and organic carbon (OC). Seven-day integrated samples were collected on four consecutive weeks during one month of each season. A few sites also had some monitoring equipment that used pumps, which permited shorter sampling times for those measurements (four sites with total VOC by ppbRAE PID, PM2.5 mass by TSI DustTrak, and black carbon (BC) by DRI Photoacoustic; one site with carbon monoxide (CO) by Q-Trak). The samplers and monitors used in the saturation monitoring project were located in community locations (e.g., schools, fire stations) and in the backyards of volunteers. The saturation monitoring sites were selected based on proximity to sources, areas of concern raised by the community, and local meteorology (i.e., wind direction and speed). Preliminary results from the Mobile Monitoring (#2) project were used to select the final site locations.
Saturation Monitoring Sites
Please see the map and map keys below.

The slide below is the first part of the description of the monitoring configurations for the map symbols on the map key slide above

The slide below is the second part of the description of the monitoring configurations for the map symbols on the map key slide above

- DRI Saturation Monitoring - Technical Proposal (pdf - 523 KB)
- DRI Saturation Monitoring - Final Report (pdf - 3622 KB)
Click here to go back to the Main Page of Harbor Communities Monitoring Study.
To receive updates on this web page and the Harbor Communities Monitoring project, please subscribe to the HCM listserve.
