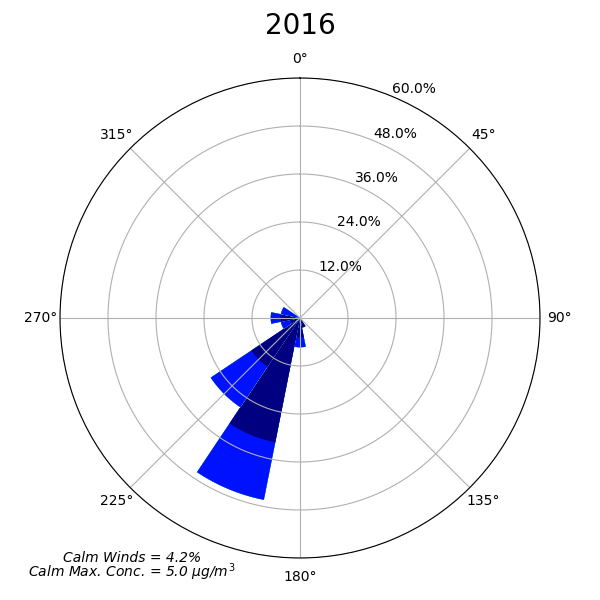
Wind Rose and Pollution Rose Diagrams
Date
Contact
Categories
Topics
Programs
The script creates wind rose and pollution rose plots using pollutant, wind speed, and wind direction data. It is a Python based script using and its libraries. Both Python, a programming language, and its libraries are open source and publicly available to download, install, and use under appropriate licenses. The script was designed by California Air Resources Board Staff for assessment of community air quality information.

Previous Versions
Wind Rose and Pollution Rose Diagrams, dated July 10, 2020
Supporting Media
Readme Document
README_20200925.DOCX · 18 KB
License
LICENSE_20200925.TXT · 1 KB
GNU Public License
COPYING_20200925.TXT · 36 KB
Pollution Rose Python script
POLLROSE_MPL_09082020.PY_.TXT · 8 KB
Pollution Rose Python Job script
POLLROSE_MPL_09082020.JOB_.TXT · 2 KB
Sample Data File - January
JANUARY_DATA.CSV · 2 KB
Sample Data File - April
APRIL_DATA.CSV · 2 KB
Wind Rose Python script
WINDROSE_MPL_09082020.PY_.TXT · 7 KB
Wind Rose Python Job script
WINDROSE_MPL_09082020.JOB_.TXT · 2 KB
Pollution Rose Sample Plot - January
PROSE_JAN_1-15-2016_1-16-2016.PDF · 36 KB
Pollution Rose Sample Plot - April
PROSE_APR_1-15-2016_1-16-2016.PDF · 37 KB
Wind Rose Sample Plot - January
WROSE_JAN_1-15-2016_1-16-2016.PDF · 37 KB
Wind Rose Sample Plot - April
WROSE_APR_1-15-2016_1-16-2016.PDF · 38 KB
