

Safe Routes and Active Transportation for Schools and Underserved Communities in Hayward
Clean Mobility in Schools Pilot Project
City of Hayward | Safe Routes and Active Transportation for Schools and Underserved Communities in Hayward
June 2024 - June 2027
Project Details
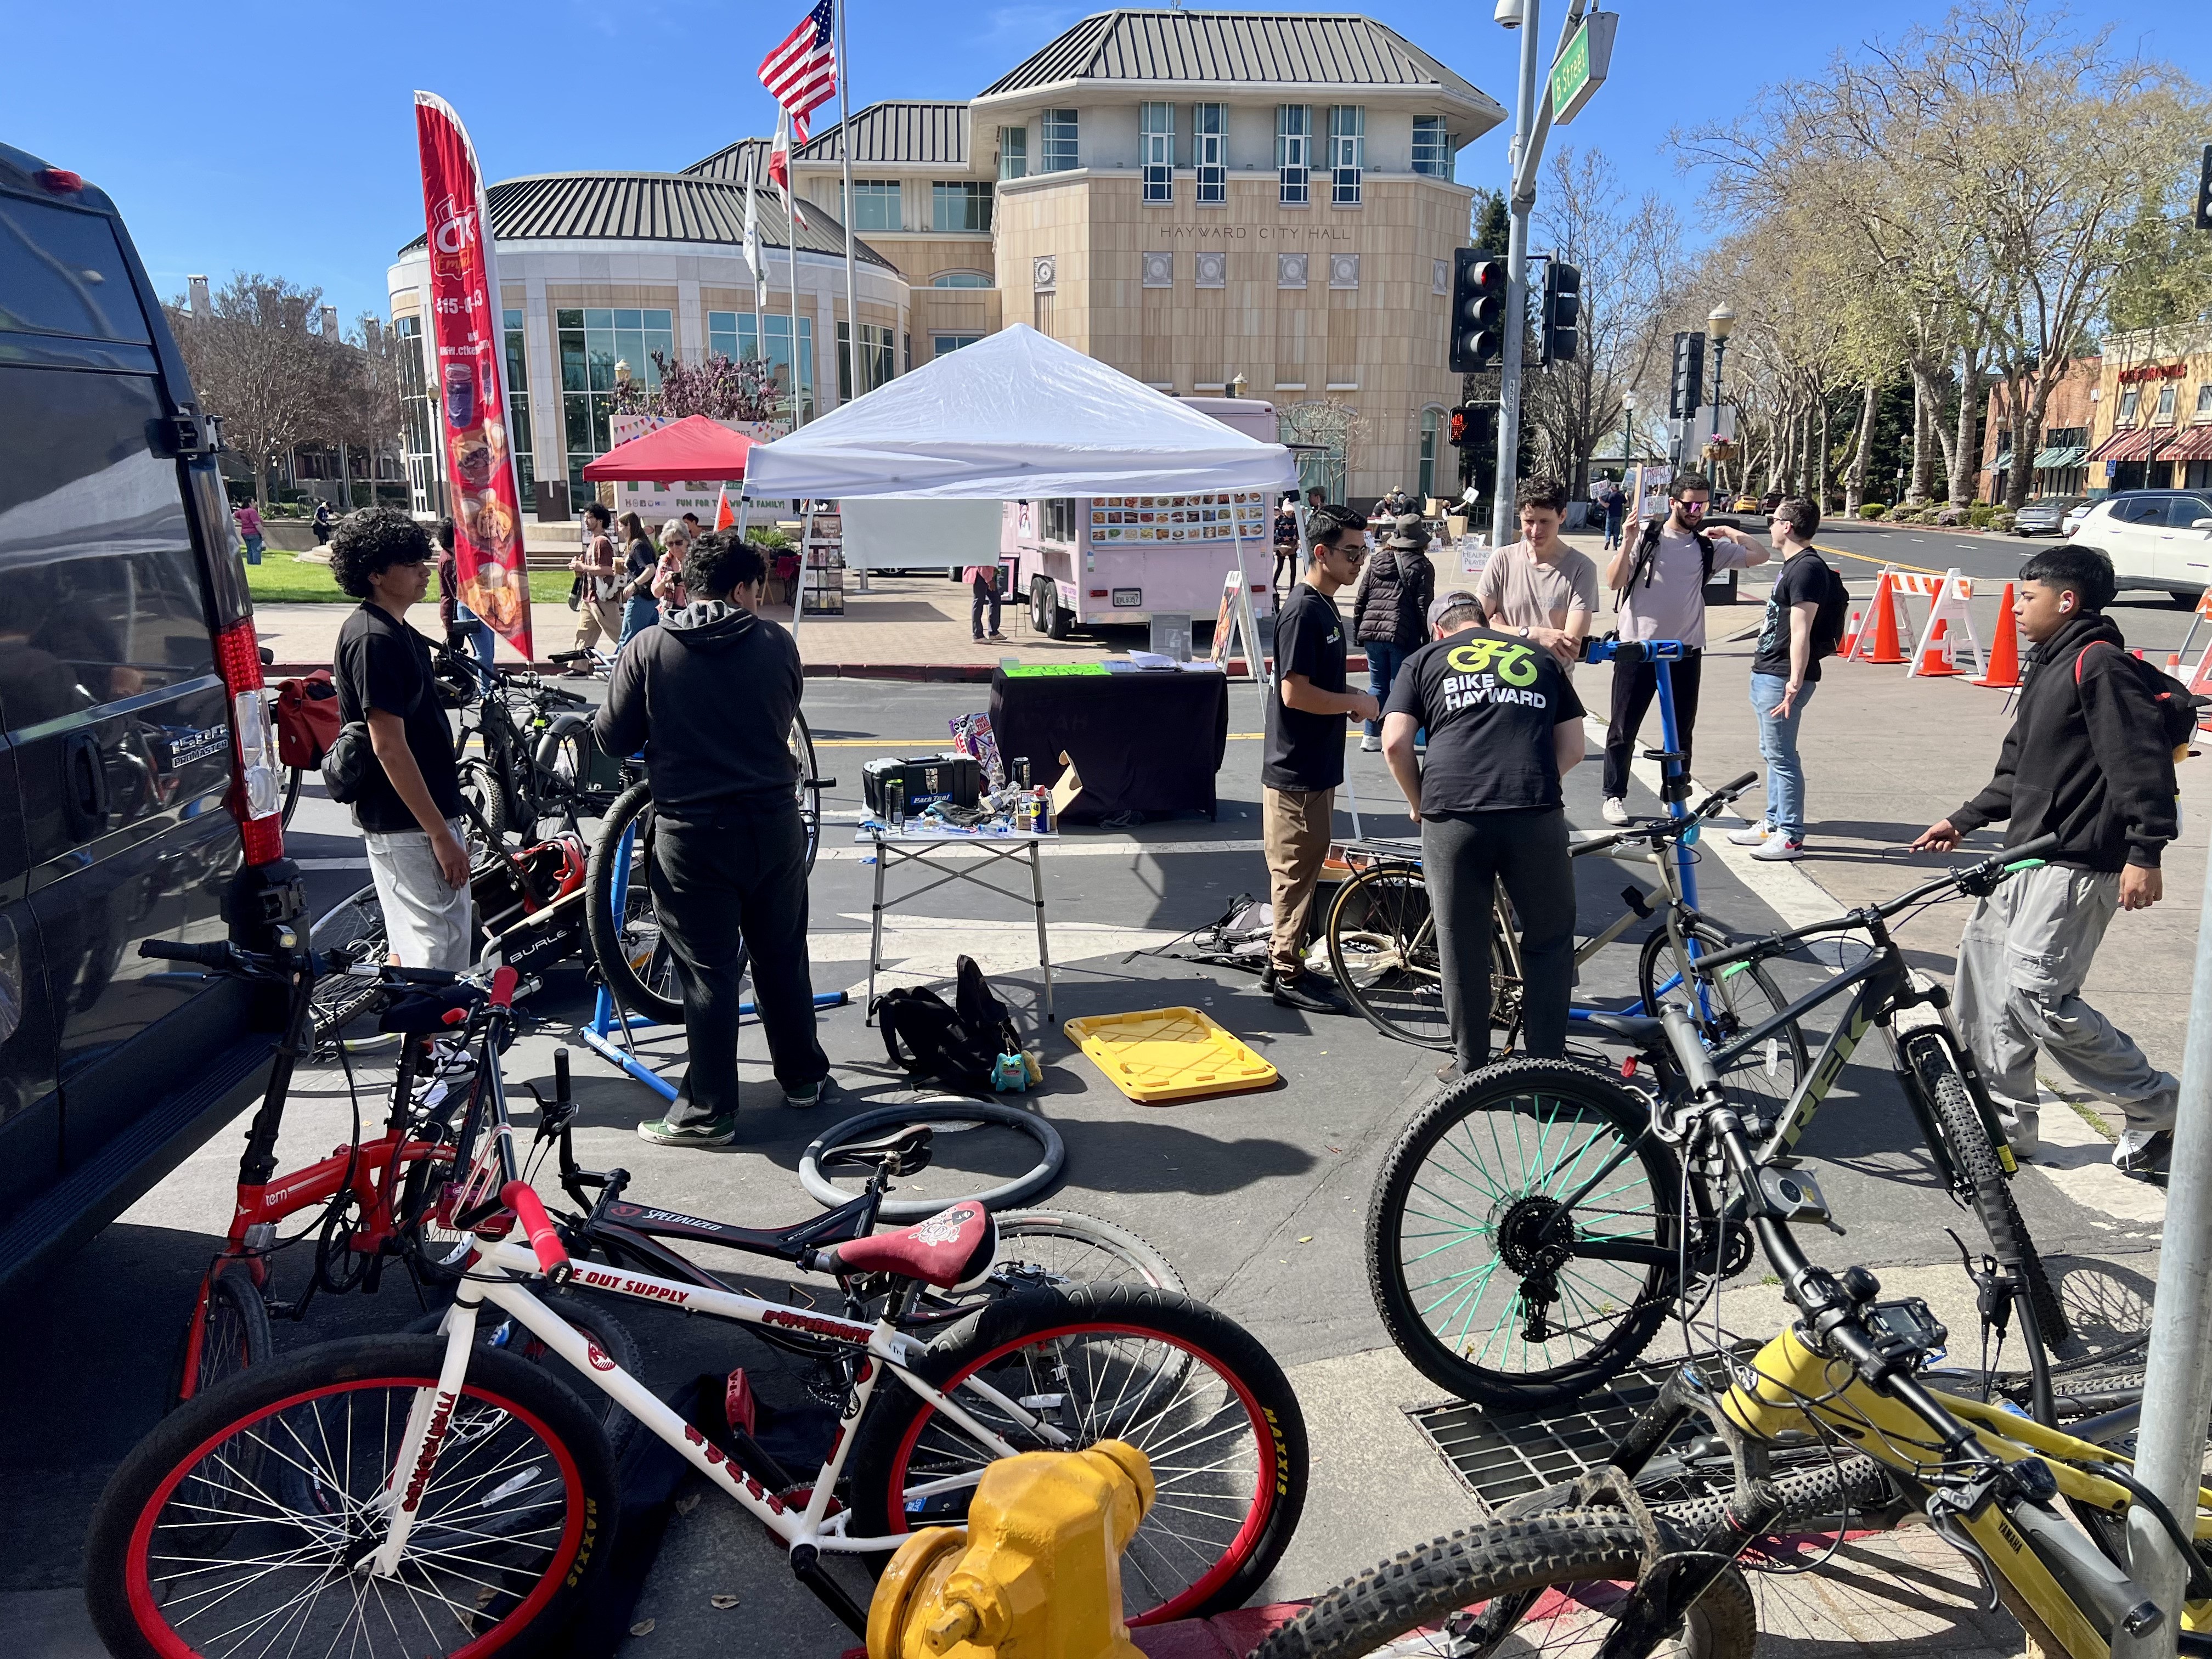
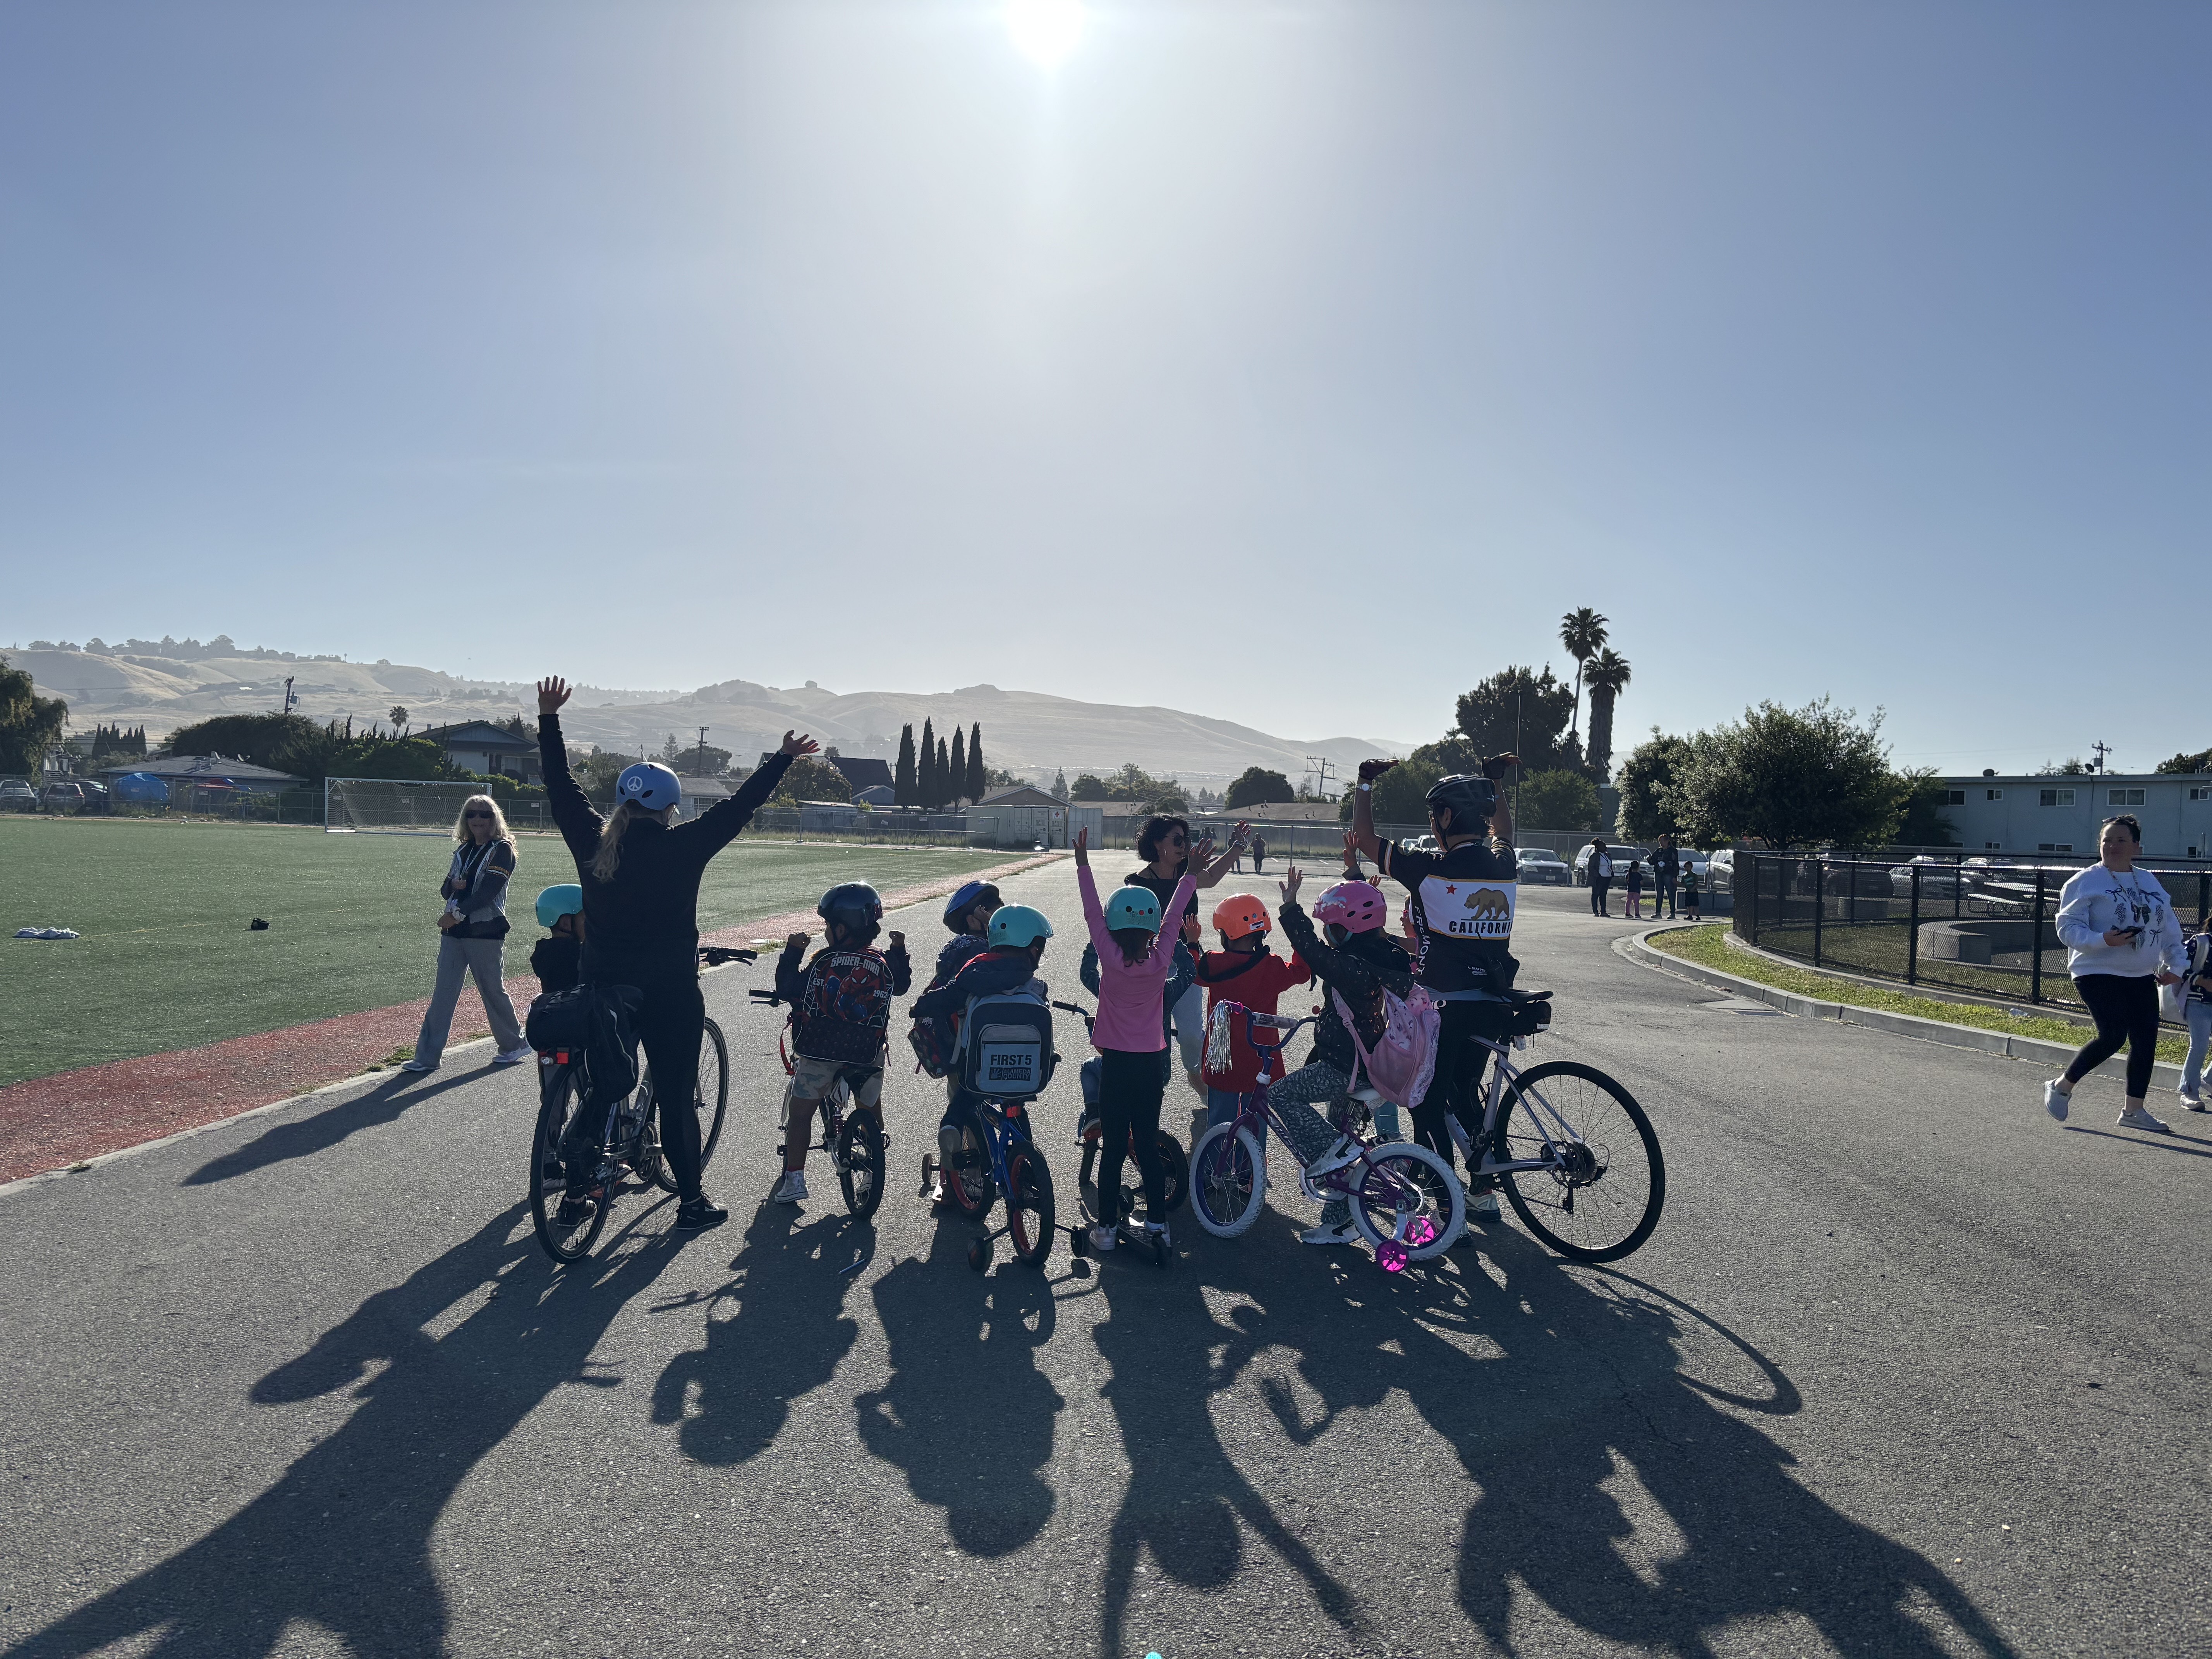
The City of Hayward aims to provide safe, affordable active transportation while reducing transportation-related emissions for residents, especially in disadvantaged and low-income communities. Implementation of Safe Routes to Schools strategies will improve pedestrian and bicyclist safety around 11 schools in Hayward. Infrastructure will be paired with a Hayward Rides bike giveaway program and bike education workshops, created through public and school community engagements and partnerships.


Funding Details
Grant Amount: $6,206,508
By the Numbers
Services, Vehicles & Equipment Funded
- 2,000 bikes to be distributed; all bikes, safety gear (helmet, locks) are purchased for future Hayward Rides events.
- 11 school sites to be improved for Safe Routes to School infrastructure updates
- School events promoting active transportation (Walk & Roll, Ruby Bridges Day, Golden Sneaker, etc.).
- Cycling classes including Adult learn-to-ride urban cycling, and group rides.
Estimated Quantifiable Benefits
- GHG emission reductions: 278 MTCO2e
- NOx reductions: 102 lbs
- PM2.5 reductions: -3 lbs
- ROG reductions: 17 lbs
Community Details
The City of Hayward has a population of 162,000 with an ethnically diverse community. Approximately 59% of the City’s population speak a language other than English at home, including 31% Spanish, 7% other Indo-European languages, and 19% Asian and Pacific Island Languages. Hayward is predominately comprised of low-income or disadvantaged census tracts, especially in the northern, central, western, and southern parts of the City as identified by the CA Department of Housing and Community Development and CA Environmental Protection Agency.
Although Hayward is in the center of the Bay Area and there are bike facilities and regional public transit providers such as AC Transit and BART, Hayward residents mostly travel to work by car (drive alone – 68%) and significantly fewer residents walk (1%), bike (0.3%), or use public transportation (7.6%). Nearly half of the City’s residents have been interested in biking but are concerned due to a lack of safe infrastructure and inadequate end-of-trip facilities such as secure bike parking per the City’s Bicycle and Pedestrian Master Plan (2020).
Partners
Grantee
Subgrantees
- Bike East Bay
- Hayward Unified School District
- TransForm
- Teach Earth Action
- Eden Youth
- Sanbell
- Trek
- Specialized
Community Partners
Contact
Jade Kim | (510) 583-4791 | City of Hayward