2020 saw steepest drop in carbon pollution due to the pandemic
Contacts
Categories
SACRAMENTO – California’s latest Greenhouse Gas Inventory indicated that in 2020 – when many Californians stayed home due to COVID-19 – carbon pollution saw the single largest decline as a percentage of the previous year’s total in the more than 20 years the state has been tracking emissions. Greenhouse gas emissions in the state fell by 35.3 million metric tons (MMT) of carbon dioxide equivalent (CO2e). This reduction of 9% exceeds the second-largest drop the state experienced between 2008 and 2009 when GHG emissions dropped 6% during the height of the Great Recession.
“2020 was the start of the COVID-19 pandemic, unprecedented and unique, turning our lives upside down,” CARB Executive Officer Dr. Steven Cliff said. “That is also true of the greenhouse gas emissions from that year – we stayed home, drove less and industry slowed down. As an outlier, 2020 cannot be used as a reliable data point to predict trends for the years that come after it. It also made clear, however, that as we build back, we must continue with the actions that we know will reduce greenhouse gases and clean the air in our hardest hit communities, including deployment of renewable energy, and zero-emission cars and trucks on our roads and highways.”
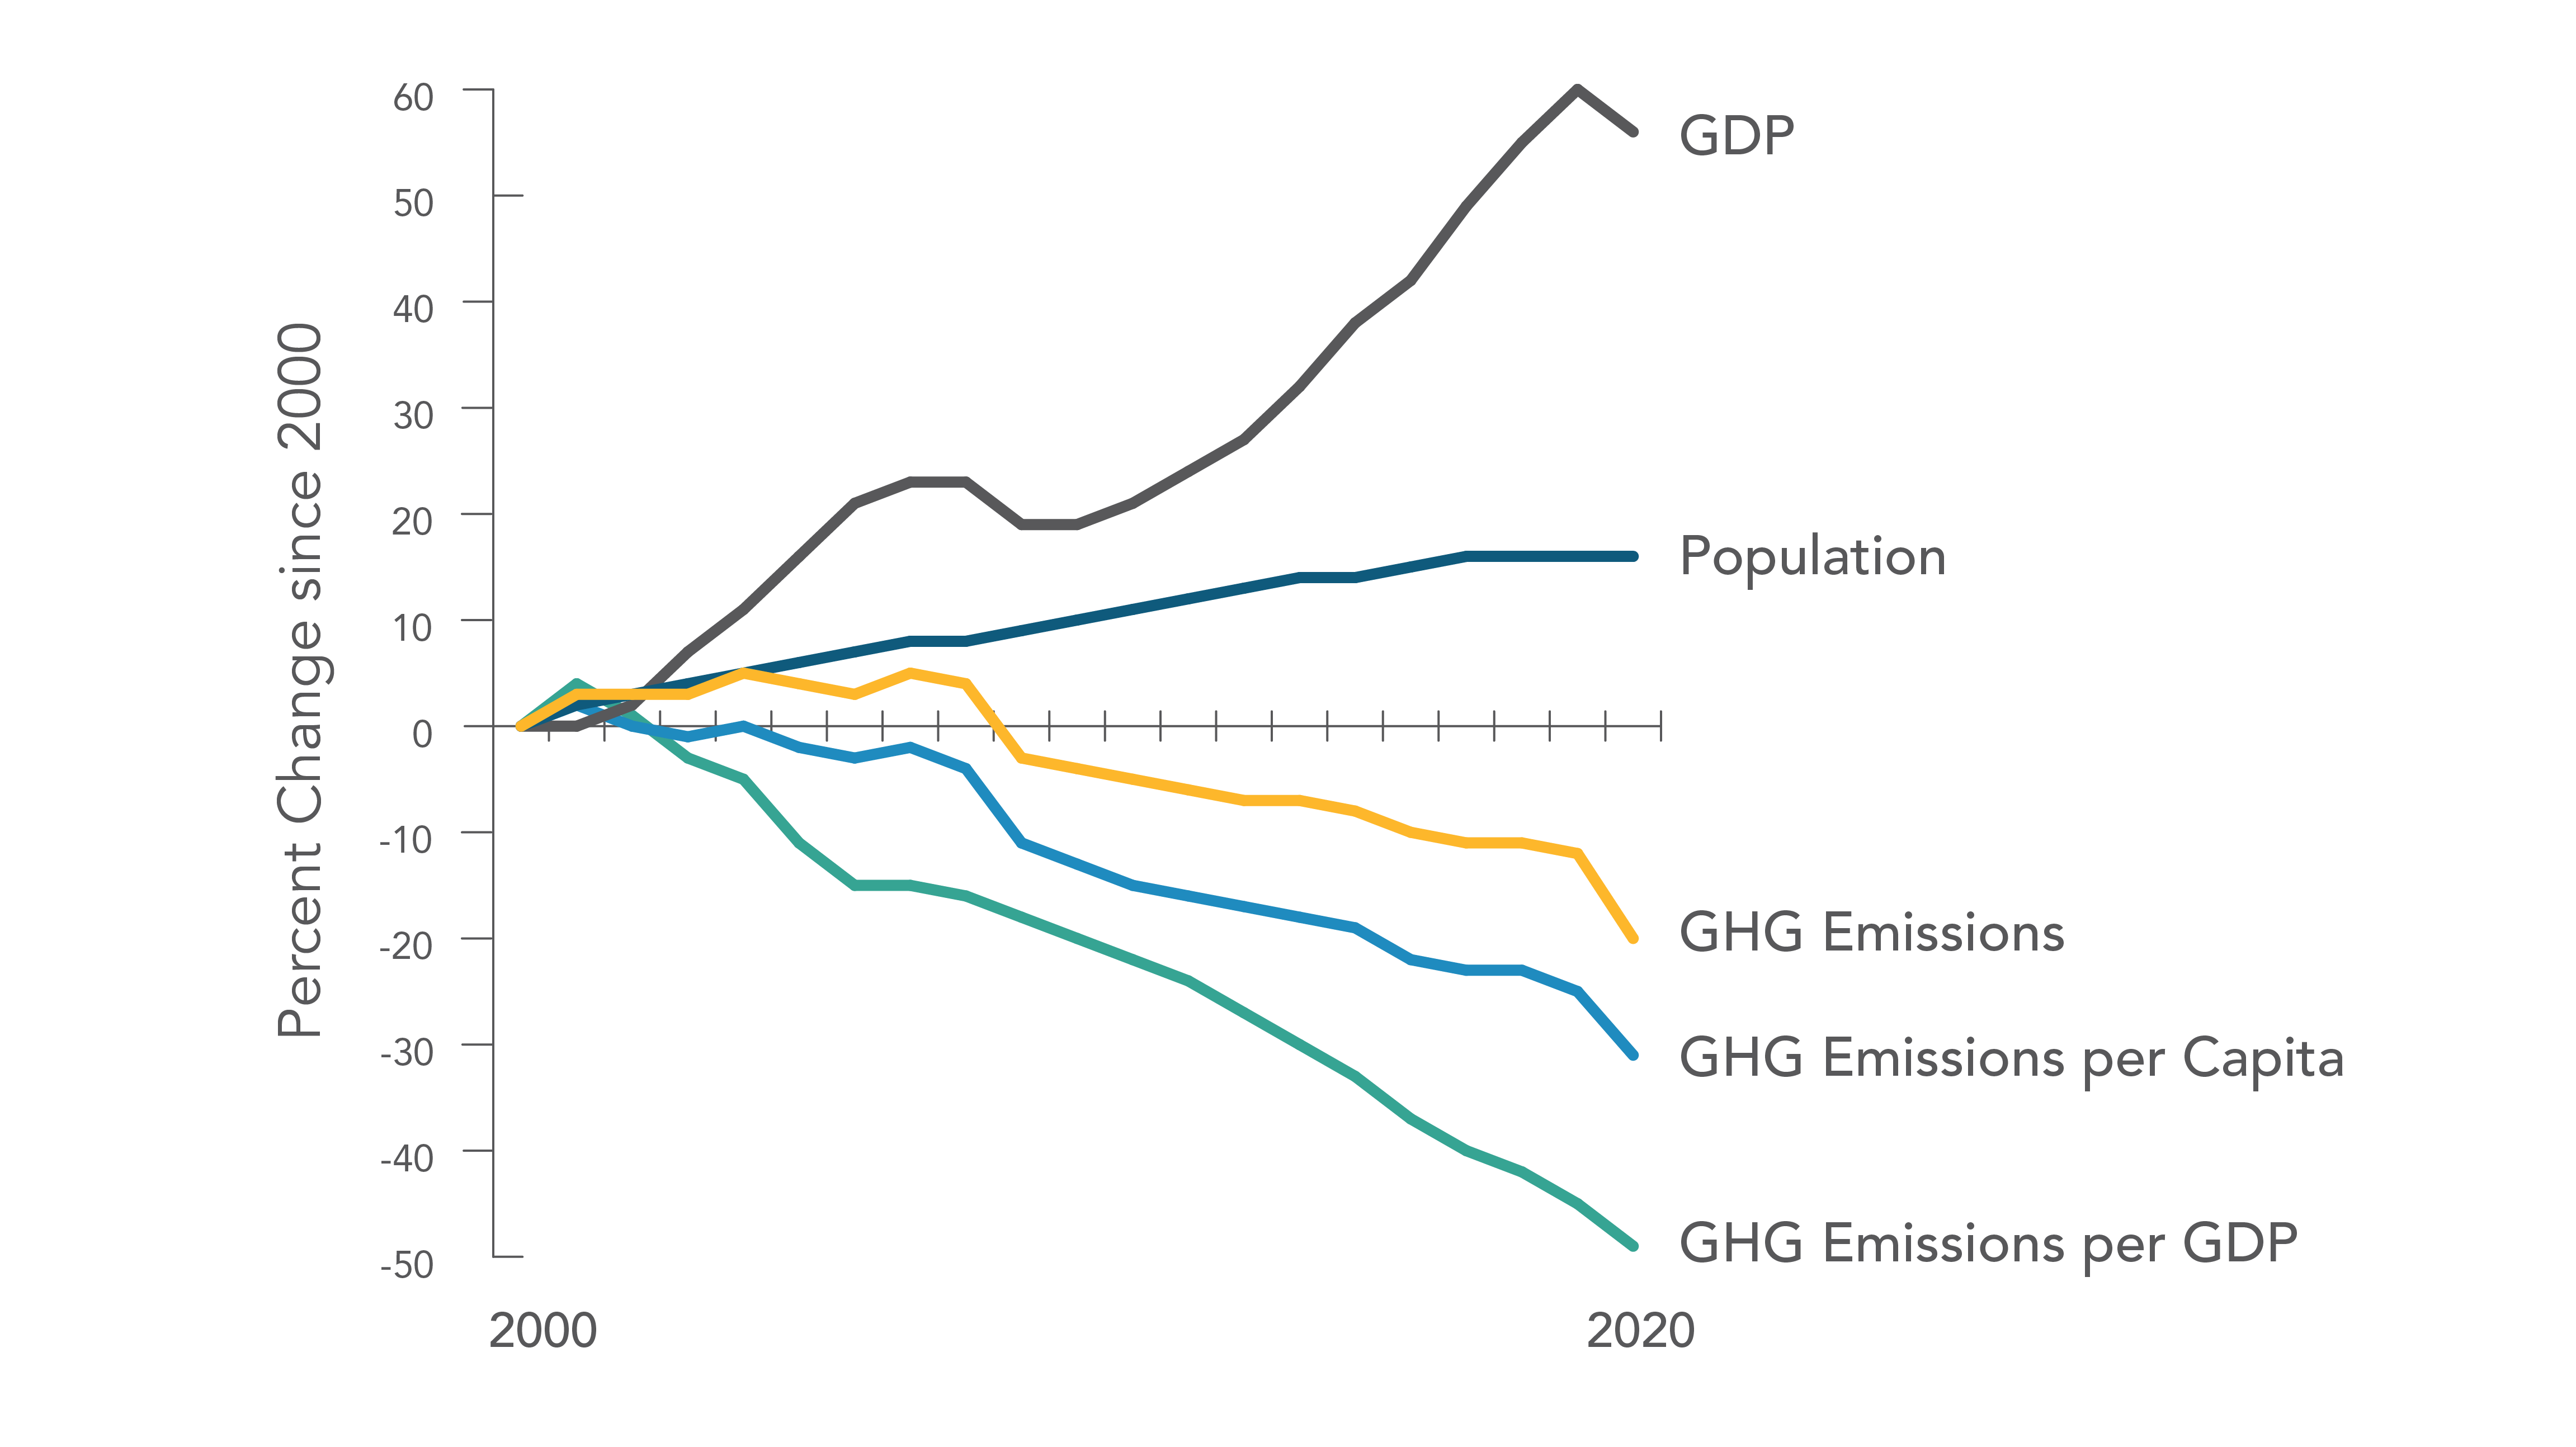
Overall, the annual drop in greenhouse gas emissions was mirrored by a smaller, but still significant 2.8% drop in the state’s GDP. Notably the greenhouse gas emissions per unit of GDP, which reflects how carbon intensive the economy is, also continued to fall, demonstrating the effectiveness of California’s long-term climate programs to decarbonize industry, energy and transportation. Another result was the continued reduction in the greenhouse gas emissions per capita, which now stands at 9.3 metric tons CO2e per person in California compared to 13.1 metric tons CO2e per person when AB 32, the Global Warming Solutions Act, was signed in 2006.
Additionally, the 2022 Edition of the AB 32 GHG Inventory corrects a data discrepancy that was identified during the detailed reconciliation process of the inventory development. As a result, it became clear that California met the AB 32 goal of returning to 1990 levels of emissions (431 MMT) in 2014 rather than 2016 after the inventory for that year was adjusted from 443 MMT to 428.2 MMT.
2020 GHG Inventory

California Sectors Overview

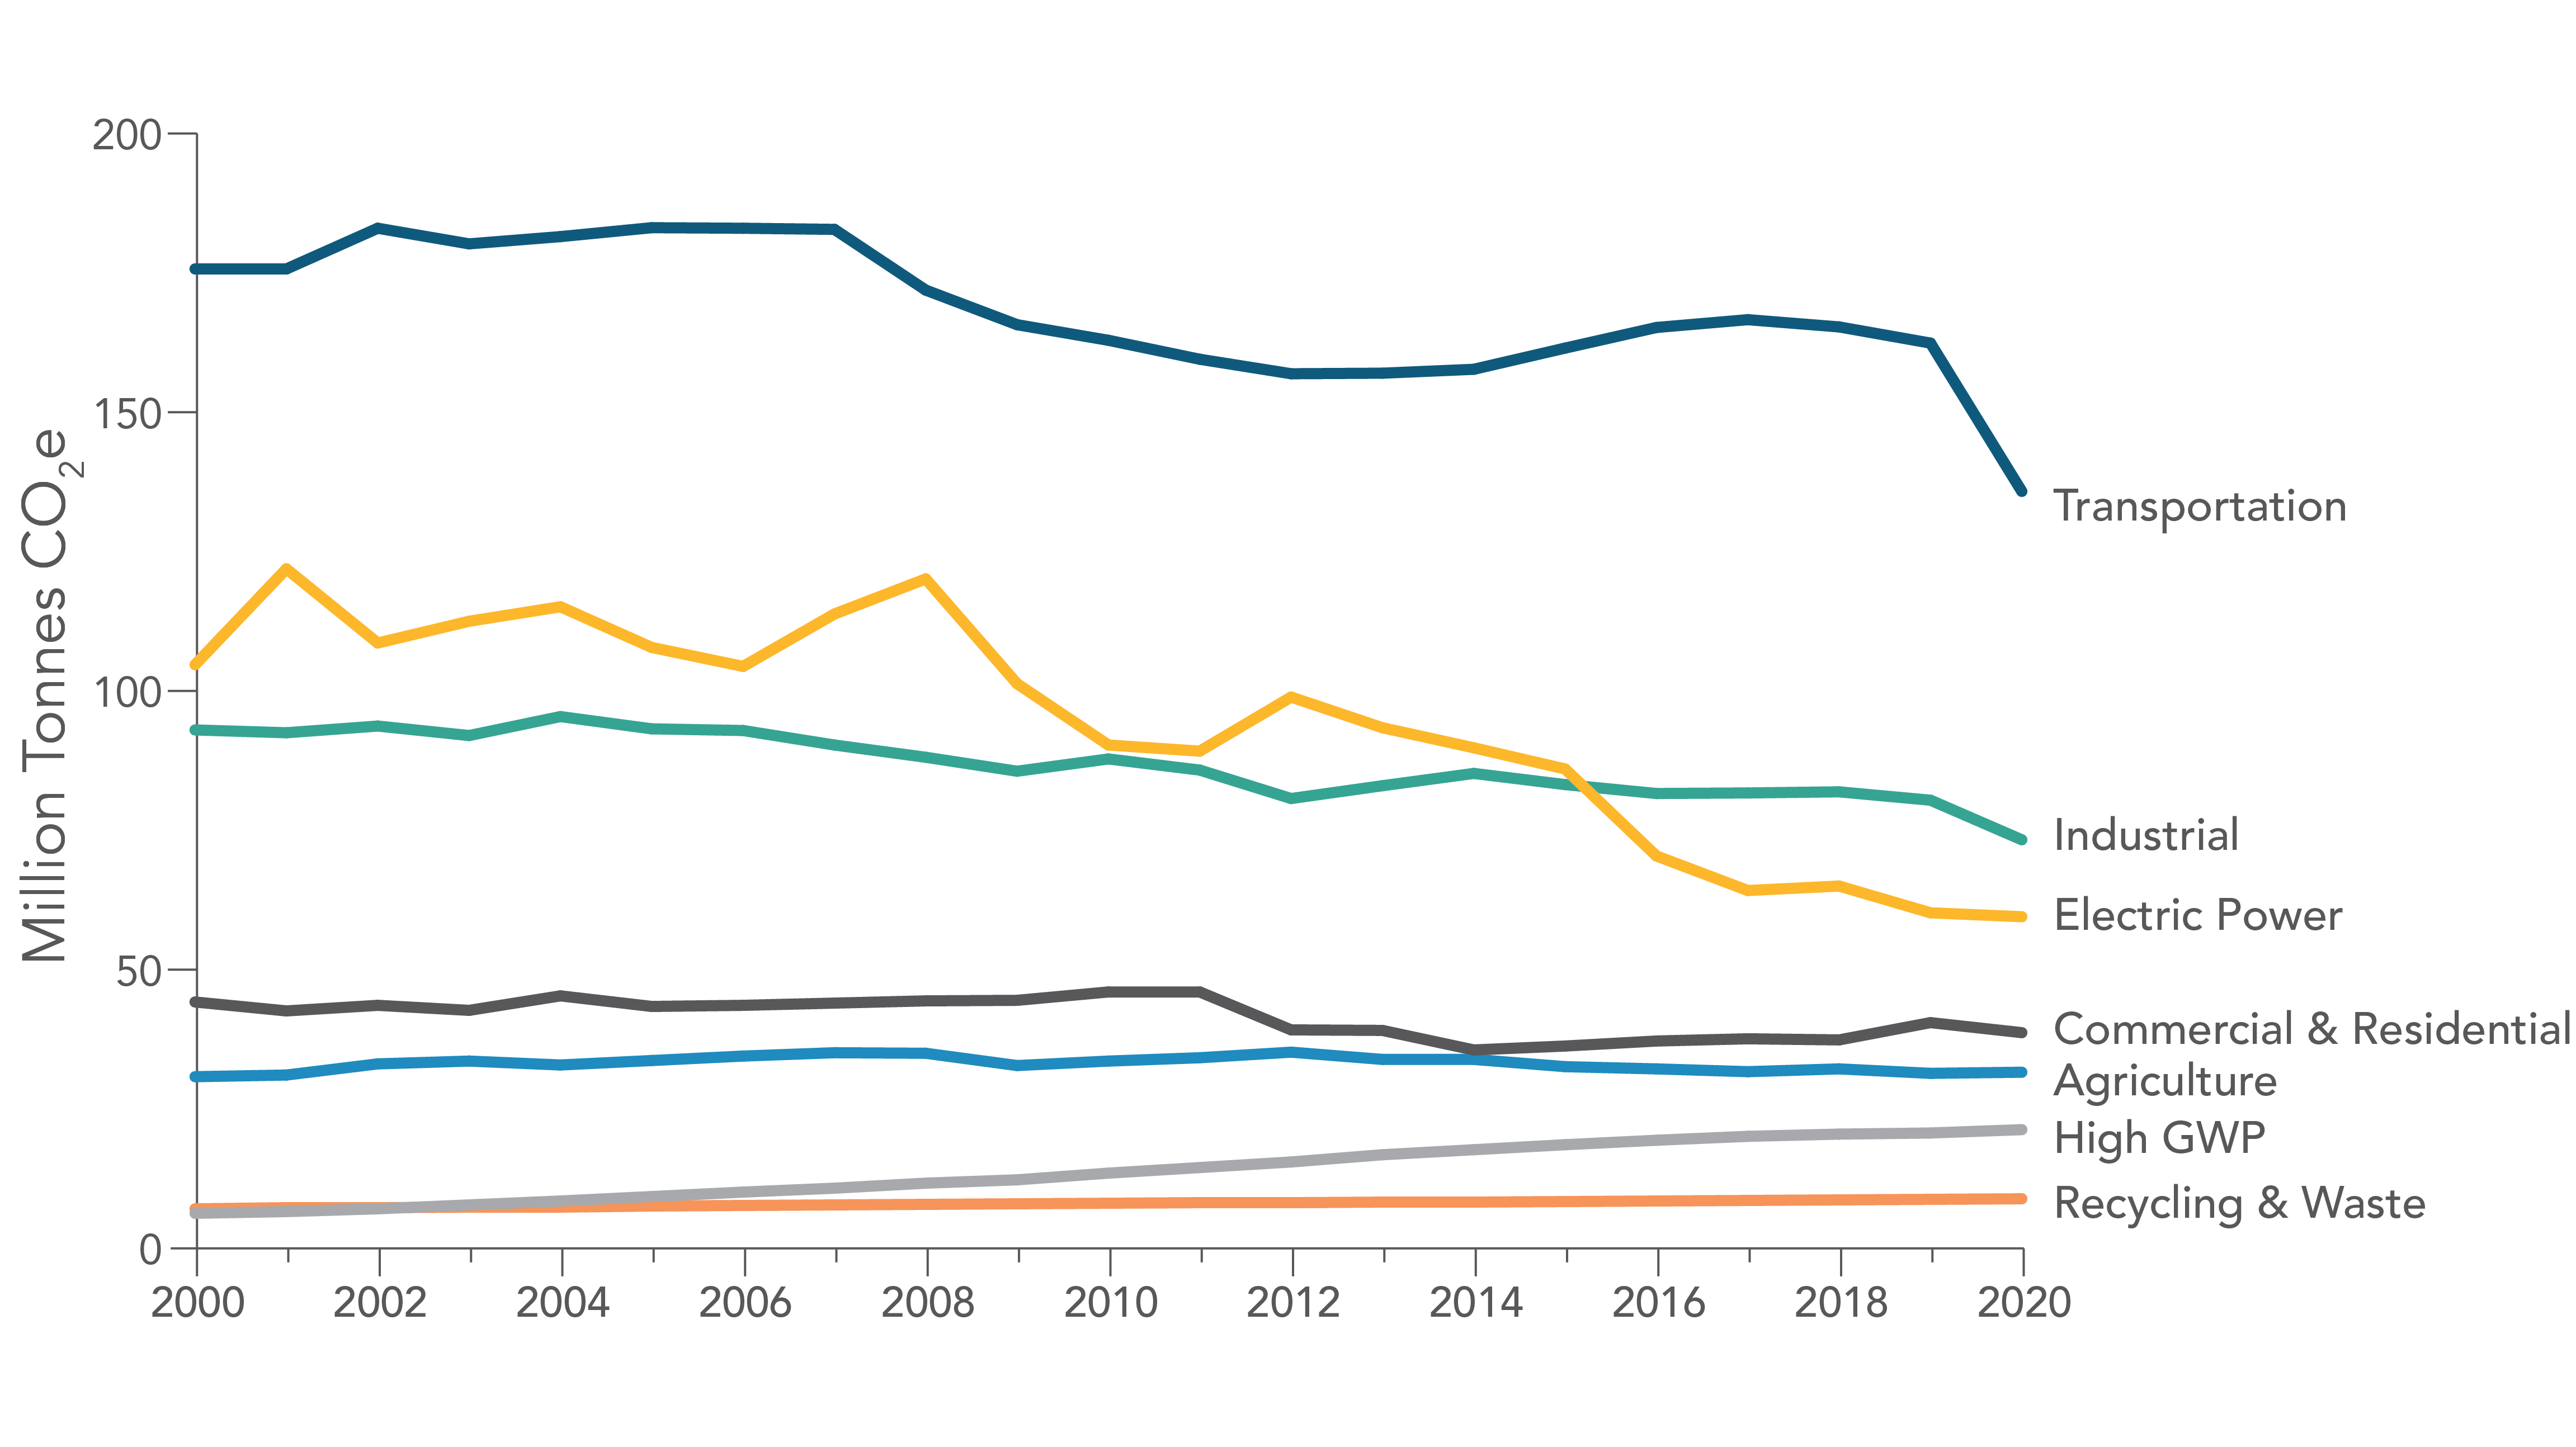
Tailpipe emissions from the transportation sector continued to be the dominant sources of greenhouse gas emissions, accounting for 37% of the 2020 inventory, with transportation overall, including extraction and refining, still accounting for approximately half of the state’s GHG inventory. But the transportation sector also had the steepest decline in 2020, dropping 16%, likely a result of the shelter-in-place orders and a consequent drop in vehicle miles traveled. This decline in greenhouse gas emissions was also buoyed by an 18% growth in electric cars, a continuing improvement in the overall fuel efficiency of cars in the state, and the continuing rise of the use of bio- and renewable diesel fuel for heavy-duty trucks which now constitute 21% of all diesel fuel sold in the state in 2020.
Share of Bio- and Renewable Diesel Continued to Rise

Other sectors also saw steep declines of greenhouse gas emissions: Industry dropped by 7 MMT (9%) overall led by a reduction of 13% in oil and gas production emissions, and a 10% drop in refining and hydrogen production emissions as demand dropped during the pandemic for petroleum products.
Residential and commercial sectors saw a 1.7 MMT drop in emissions, in part due to a warmer winter but also a reduction in fossil (natural) gas in the commercial sector as a result of the slowdown during the pandemic.
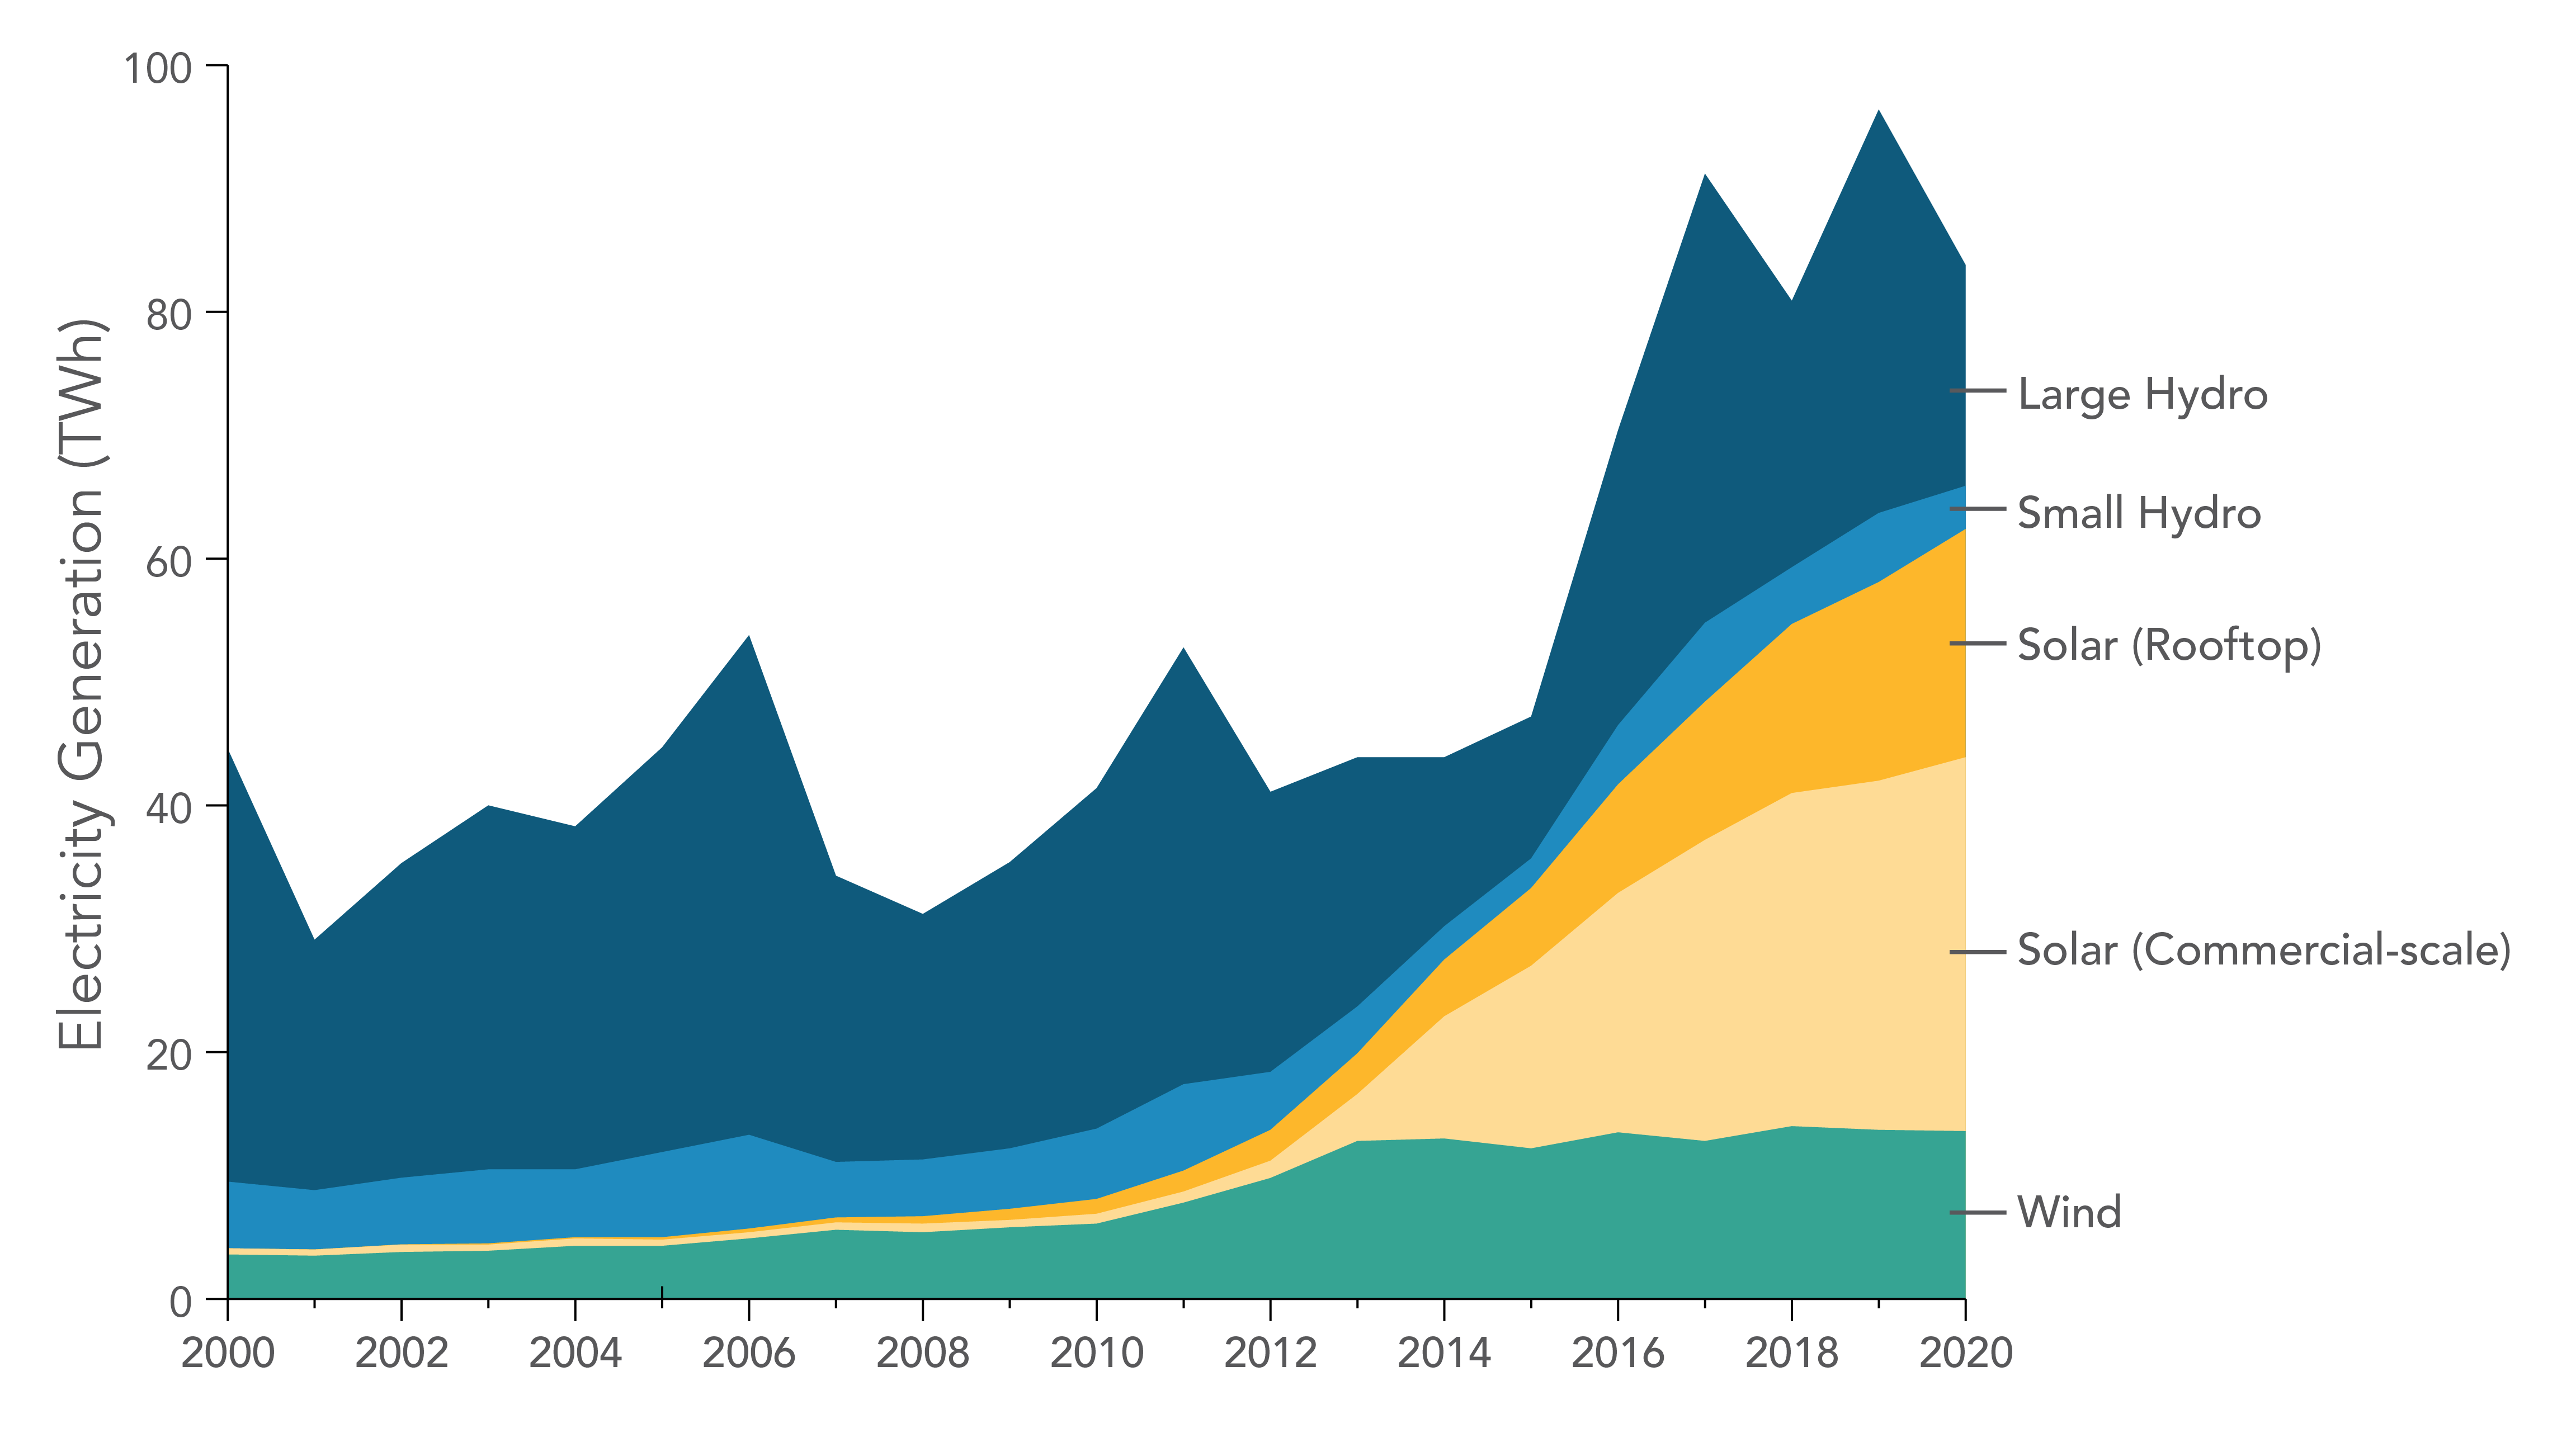
Total electric power emissions remained at a similar level to 2019, despite a 44% percent decrease in in-state hydropower generation, the result of deeply reduced precipitation that winter. This loss in hydropower, however, was more than compensated for by a 10% growth in in-state solar generation, and cleaner imported electricity incentivized by California’s clean energy policies.
In-State Hydro, Solar, and Wind Electricity Generation

This figure shows the amounts of electricity generated by California’s in-state wind power projects, large commercial-scale solar power projects, rooftop solar panels, and hydropower generation stations.
One category that saw an uptick was high global-warming potential chemicals, mostly HFCs (hydrofluorocarbons) used for refrigeration, air conditioning and insulation, and other gases specifically created to replace ozone depleting chemicals that are being phased out under the Montreal Protocol. Emissions of these powerful greenhouse gases continue to grow, rising from 1.4% in 2000 to 5.8% of all greenhouse gas emissions in 2020.
HFC emissions by use and type

In addition, the 2022 Edition of the AB 32 GHG Inventory features an adjustment of the sectoral totals to correct a data discrepancy that was identified during the detailed reconciliation process of the inventory development. The adjustment of sectoral totals included aligning several sectors related to fossil gas and diesel fuel usage with data from the Regulation for the Mandatory Reporting of GHG Emissions (MRR), and a correction for volumes of fossil gas used in refineries. This adjustment resulted in lowering the 2019 emissions from 418.2 million metric tons of carbon dioxide equivalents (MMT CO2e) to 404.5 MMT CO2e, an overall reduction of 3.3%.
To ensure conformity, inventories from previous years also have been adjusted, which resulted in California exceeding its 2020 climate target six years ahead of schedule in 2014, rather than the previous estimate of 2016.
There have been previous changes in methodology to the GHG Inventory. In the past, changes in the inventory were made to reflect shifts in the global warming potential of some gases as determined by the Intergovernmental Panel on Climate Change (IPCC). The current changes to the inventory methodology do not affect the Draft or Final 2022 Scoping Plan Update as it relies on both reported and third-party verified data collected under the Mandatory Reporting Regulation MRR and, to a lesser extent, external data sources. Additionally, for individual programs or regulations such as the Low Carbon Fuel Standard and Cap-and-Trade, CARB relies on data directly collected from the regulated sources, which are third-party verified and established in regulation. These programs are not impacted by the adjustment described above.
